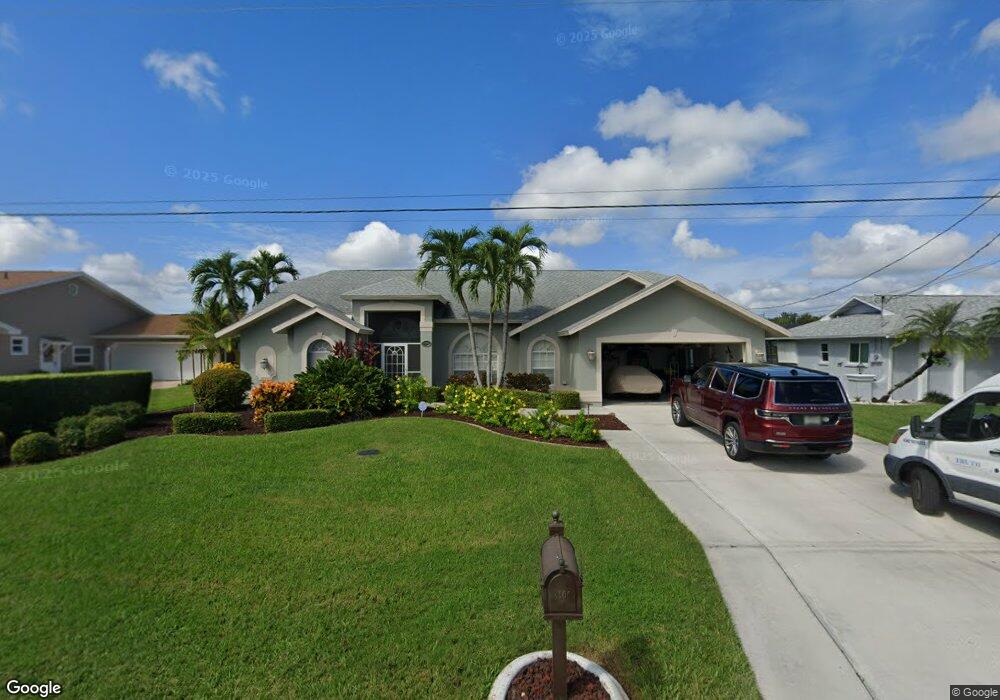
4506 SW 5th Ave Unit 44 Cape Coral, FL 33914
Pelican NeighborhoodEstimated Value: $676,481
4
Beds
2
Baths
3,815
Sq Ft
$177/Sq Ft
Est. Value
About This Home
This home is located at 4506 SW 5th Ave Unit 44, Cape Coral, FL 33914 and is currently priced at $676,481, approximately $177 per square foot. 4506 SW 5th Ave Unit 44 is a home located in Lee County with nearby schools including Cape Elementary School, Caloosa Elementary School, and Tropic Isles Elementary School.
Ownership History
Date
Name
Owned For
Owner Type
Purchase Details
Closed on
Jul 27, 2018
Sold by
Cordoma Caryn L
Bought by
Christensen Brenda Lacy
Current Estimated Value
Home Financials for this Owner
Home Financials are based on the most recent Mortgage that was taken out on this home.
Original Mortgage
$298,800
Outstanding Balance
$258,412
Interest Rate
4.5%
Mortgage Type
New Conventional
Purchase Details
Closed on
Jun 18, 2004
Sold by
Manning Donald and Manning Darlene
Bought by
Cordoma Caryn L
Home Financials for this Owner
Home Financials are based on the most recent Mortgage that was taken out on this home.
Original Mortgage
$311,250
Interest Rate
6.3%
Mortgage Type
Unknown
Purchase Details
Closed on
Sep 2, 2003
Sold by
Krainer Kevin and Krainer Robin
Bought by
Manning Donald
Purchase Details
Closed on
Apr 30, 1999
Sold by
Hertl Burkhard
Bought by
Krainer Kevin T and Hoppe Robin M
Create a Home Valuation Report for This Property
The Home Valuation Report is an in-depth analysis detailing your home's value as well as a comparison with similar homes in the area
Home Values in the Area
Average Home Value in this Area
Purchase History
| Date | Buyer | Sale Price | Title Company |
|---|---|---|---|
| Christensen Brenda Lacy | $375,000 | All American Title Co | |
| Cordoma Caryn L | $415,000 | Fidelity National Title Insu | |
| Manning Donald | $340,000 | -- | |
| Krainer Kevin T | $20,900 | -- |
Source: Public Records
Mortgage History
| Date | Status | Borrower | Loan Amount |
|---|---|---|---|
| Open | Christensen Brenda Lacy | $298,800 | |
| Previous Owner | Cordoma Caryn L | $311,250 | |
| Closed | Cordoma Caryn L | $41,500 |
Source: Public Records
Tax History Compared to Growth
Tax History
| Year | Tax Paid | Tax Assessment Tax Assessment Total Assessment is a certain percentage of the fair market value that is determined by local assessors to be the total taxable value of land and additions on the property. | Land | Improvement |
|---|---|---|---|---|
| 2025 | $6,525 | $410,650 | -- | -- |
| 2024 | $6,525 | $399,077 | -- | -- |
| 2023 | $6,350 | $387,453 | $0 | $0 |
| 2022 | $6,019 | $376,168 | $0 | $0 |
| 2021 | $6,254 | $408,671 | $114,586 | $294,085 |
| 2020 | $6,381 | $360,170 | $0 | $0 |
| 2019 | $6,205 | $352,072 | $60,900 | $291,172 |
| 2018 | $6,837 | $352,059 | $58,000 | $294,059 |
| 2017 | $6,264 | $301,194 | $53,000 | $248,194 |
| 2016 | $6,345 | $303,318 | $88,798 | $214,520 |
| 2015 | $6,073 | $282,499 | $72,278 | $210,221 |
| 2014 | -- | $316,095 | $80,278 | $235,817 |
| 2013 | -- | $277,201 | $73,909 | $203,292 |
Source: Public Records
Map
Nearby Homes
- 4416 SW 5th Ave
- 4414 SW 5th Place
- 4502 SW 6th Ave
- 4417 SW 6th Place
- 413 SW 46th Terrace
- 4519 Pelican Blvd
- 418 SW 46th Terrace
- 4627 SW 5th Place
- 4538 SW 6th Place
- 4404 SW 7th Ave
- 245 SW 44th Terrace
- 505 SW 47th Terrace Unit 104
- 429 SW 47th Terrace Unit 1-4
- 425 SW 47th Terrace Unit 5-8
- 245 SW 46th Terrace
- 413 SW 43rd Terrace
- 4618 SW 7th Ave
- 403 SW 47th Terrace Unit 203
- 4528 SW 7th Place
- 619 SW 43rd Ln
- 4506 SW 5th Ave
- 4502 SW 5th Ave
- 4510 SW 5th Ave
- 4428 SW 5th Ave
- 4514 SW 5th Ave
- 4509 SW 5th Ave
- 4505 SW 5th Ave
- 4513 SW 5th Ave
- 4515 SW 5th Place
- 4424 SW 5th Ave
- 4511 SW 5th Place
- 4511 SW 5th Place Unit A-B
- 4519 SW 5th Place
- 4520 SW 5th Ave
- 4517 SW 5th Ave Unit 44
- 4517 SW 5th Ave
- 4523 SW 5th Place
- 4507 SW 5th Place
- 426 SW 45th St
- 429 SW 45th St