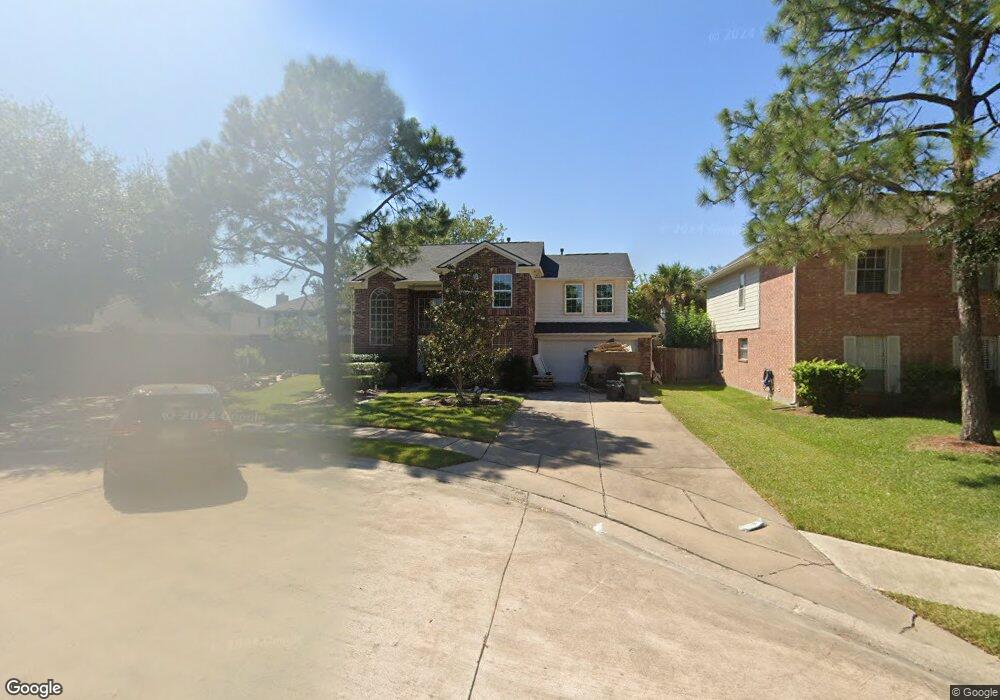
4507 Brookren Ct Pearland, TX 77584
Southwyck NeighborhoodEstimated Value: $322,657 - $362,000
3
Beds
3
Baths
2,397
Sq Ft
$142/Sq Ft
Est. Value
About This Home
This home is located at 4507 Brookren Ct, Pearland, TX 77584 and is currently estimated at $339,914, approximately $141 per square foot. 4507 Brookren Ct is a home located in Brazoria County with nearby schools including Silverlake Elementary School, Rogers Middle School, and Berry Miller Junior High School.
Ownership History
Date
Name
Owned For
Owner Type
Purchase Details
Closed on
Jun 10, 2009
Sold by
Pandya Aashish M and Patel Dehuti S
Bought by
Mcneill Misti A
Current Estimated Value
Home Financials for this Owner
Home Financials are based on the most recent Mortgage that was taken out on this home.
Original Mortgage
$150,719
Outstanding Balance
$95,534
Interest Rate
4.83%
Mortgage Type
FHA
Estimated Equity
$244,380
Purchase Details
Closed on
May 29, 2002
Sold by
Malone Richard L and Malone Giselle L
Bought by
Pandya Aashish M and Patel Dehuti S
Home Financials for this Owner
Home Financials are based on the most recent Mortgage that was taken out on this home.
Original Mortgage
$142,000
Interest Rate
6.87%
Purchase Details
Closed on
Mar 26, 1998
Sold by
Correa Armando G and Correa Heather H
Bought by
Malone Richard L and Malone Giselle L
Home Financials for this Owner
Home Financials are based on the most recent Mortgage that was taken out on this home.
Original Mortgage
$102,600
Interest Rate
7.04%
Create a Home Valuation Report for This Property
The Home Valuation Report is an in-depth analysis detailing your home's value as well as a comparison with similar homes in the area
Home Values in the Area
Average Home Value in this Area
Purchase History
| Date | Buyer | Sale Price | Title Company |
|---|---|---|---|
| Mcneill Misti A | -- | Chicago Title | |
| Pandya Aashish M | -- | Chicago Title | |
| Malone Richard L | -- | Alamo Title Company #30 |
Source: Public Records
Mortgage History
| Date | Status | Borrower | Loan Amount |
|---|---|---|---|
| Open | Mcneill Misti A | $150,719 | |
| Previous Owner | Pandya Aashish M | $142,000 | |
| Previous Owner | Malone Richard L | $102,600 |
Source: Public Records
Tax History Compared to Growth
Tax History
| Year | Tax Paid | Tax Assessment Tax Assessment Total Assessment is a certain percentage of the fair market value that is determined by local assessors to be the total taxable value of land and additions on the property. | Land | Improvement |
|---|---|---|---|---|
| 2025 | $4,978 | $306,350 | $54,940 | $251,410 |
| 2023 | $4,978 | $266,276 | $54,940 | $257,730 |
| 2022 | $5,823 | $242,069 | $21,430 | $257,660 |
| 2021 | $5,670 | $238,140 | $21,430 | $216,710 |
| 2020 | $5,398 | $208,490 | $19,450 | $189,040 |
| 2019 | $4,908 | $181,870 | $16,480 | $165,390 |
| 2018 | $5,052 | $188,030 | $16,480 | $171,550 |
| 2017 | $4,910 | $191,860 | $16,480 | $175,380 |
| 2016 | $4,463 | $194,040 | $16,480 | $177,560 |
| 2015 | $3,372 | $153,020 | $16,480 | $136,540 |
| 2014 | $3,372 | $136,610 | $16,480 | $120,130 |
Source: Public Records
Map
Nearby Homes
- 4527 Brookren Ct
- 2815 Abbey Field Dr
- 3326 Lakeway Ln
- 3255 Lakeway Ln
- 4622 Pecan Grove Dr
- 4838 Pinder Ln
- 4311 Duesenberg Ct
- 4915 Pecan Grove Dr
- 2826 Foxden Dr
- 18685 Tree Top Ln
- 18660 Tree Top Ln
- 4811 Meadowglen Dr
- 0 Cullen Pkwy Unit 80720255
- 3901 Magnolia Pkwy
- 8335 Fite Rd
- 3021 Rocky Point Dr
- 4026 Bentley Dr
- 2534 Oak Rd
- 2526 Oak Rd
- 4146 S Webber Dr
- 4511 Brookren Ct
- 2919 Russett Place W
- 4503 Brookren Ct
- 2915 Russett Place W
- 4515 Brookren Ct
- 2923 Russett Place W
- 2911 Russett Place W
- 4502 Brookren Ct
- 2927 Russett Place W
- 4519 Brookren Ct
- 4514 Brookren Ct
- 4510 Brookren Ct
- 2907 Russett Place W
- 4506 Brookren Ct
- 4518 Brookren Ct
- 4523 Brookren Ct
- 4507 Russett Place S
- 4603 Russett Place S
- 4522 Brookren Ct
- 2918 Russett Place W