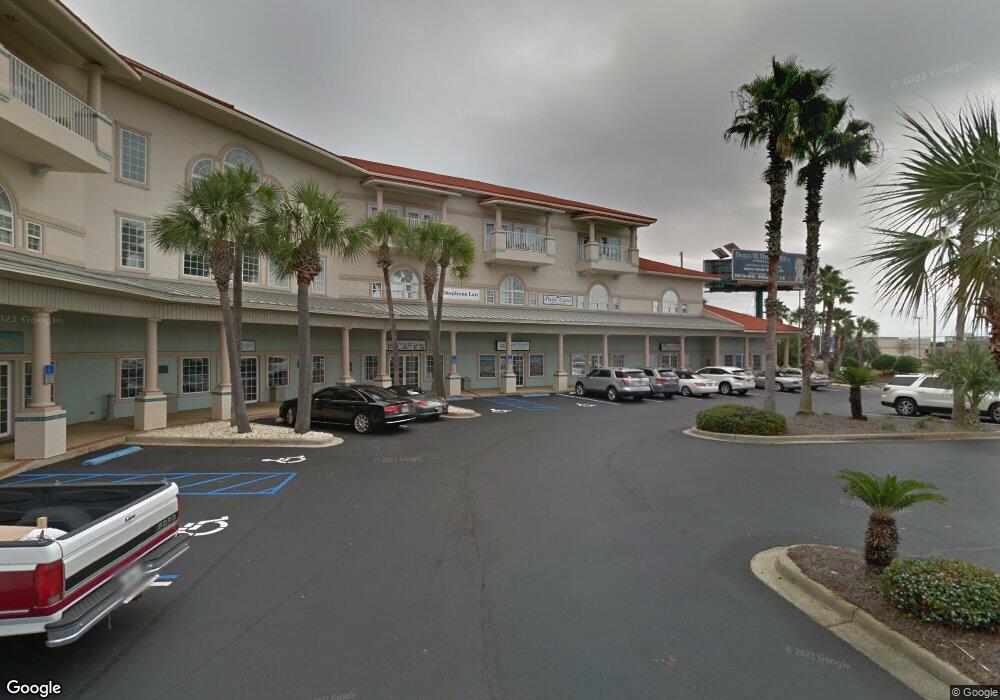
4507 Furling Ln Unit 113 Destin, FL 32541
Estimated Value: $307,613
--
Bed
2
Baths
1,410
Sq Ft
$218/Sq Ft
Est. Value
About This Home
This home is located at 4507 Furling Ln Unit 113, Destin, FL 32541 and is currently estimated at $307,613, approximately $218 per square foot. 4507 Furling Ln Unit 113 is a home located in Okaloosa County with nearby schools including Destin Elementary School, Destin Middle School, and Fort Walton Beach High School.
Ownership History
Date
Name
Owned For
Owner Type
Purchase Details
Closed on
Jul 1, 2024
Sold by
Morris Jeff W
Bought by
Clarke Staceyann Simone
Current Estimated Value
Purchase Details
Closed on
Dec 1, 2020
Sold by
Morris Jeff W and Morris Valerie
Bought by
Morris Jeff W
Purchase Details
Closed on
Nov 7, 2016
Sold by
Compass Resorts Inc
Bought by
Morris Jeff W and Morris Valerie
Home Financials for this Owner
Home Financials are based on the most recent Mortgage that was taken out on this home.
Original Mortgage
$185,000
Interest Rate
3.48%
Mortgage Type
Commercial
Purchase Details
Closed on
Mar 8, 2006
Sold by
Khaki Inc
Bought by
Olsen Mcdaniel Hardy Llc
Home Financials for this Owner
Home Financials are based on the most recent Mortgage that was taken out on this home.
Original Mortgage
$300,000
Interest Rate
6.05%
Mortgage Type
Commercial
Purchase Details
Closed on
Sep 24, 2004
Sold by
Merlins Pizza Co
Bought by
Khaki Inc
Create a Home Valuation Report for This Property
The Home Valuation Report is an in-depth analysis detailing your home's value as well as a comparison with similar homes in the area
Home Values in the Area
Average Home Value in this Area
Purchase History
| Date | Buyer | Sale Price | Title Company |
|---|---|---|---|
| Clarke Staceyann Simone | $323,200 | South Oak Title | |
| Morris Jeff W | -- | Attorney | |
| Morris Jeff W | $217,500 | Attorney | |
| Olsen Mcdaniel Hardy Llc | $358,000 | Gator Title Insurance Agency | |
| Khaki Inc | $245,000 | Emerald Coast Title Svcs Inc |
Source: Public Records
Mortgage History
| Date | Status | Borrower | Loan Amount |
|---|---|---|---|
| Previous Owner | Morris Jeff W | $185,000 | |
| Previous Owner | Olsen Mcdaniel Hardy Llc | $300,000 |
Source: Public Records
Tax History Compared to Growth
Tax History
| Year | Tax Paid | Tax Assessment Tax Assessment Total Assessment is a certain percentage of the fair market value that is determined by local assessors to be the total taxable value of land and additions on the property. | Land | Improvement |
|---|---|---|---|---|
| 2024 | $2,445 | $267,900 | -- | $267,900 |
| 2023 | $2,445 | $265,000 | $0 | $265,000 |
| 2022 | $2,298 | $250,000 | $0 | $250,000 |
| 2021 | $2,159 | $225,000 | $0 | $225,000 |
| 2020 | $1,871 | $186,200 | $0 | $186,200 |
| 2019 | $1,835 | $186,100 | $0 | $186,100 |
| 2018 | $1,721 | $173,400 | $0 | $0 |
| 2017 | $1,279 | $108,800 | $0 | $0 |
| 2016 | $1,155 | $98,911 | $0 | $0 |
| 2015 | $1,084 | $89,958 | $0 | $0 |
| 2014 | $1,091 | $89,958 | $0 | $0 |
Source: Public Records
Map
Nearby Homes
- 4694 Amhurst Cir
- 226 Talquin Cove
- 4735 Papaya Park
- 4741 Papaya Park
- 4707 Amhurst Cir
- 4709 Amhurst Cir
- 4736 Papaya Park
- 258 Calusa Blvd
- 235 Inverrary Dr
- 96 Trista Terrace Ct
- 222 Wekiva Cove
- 114 Tranquility Ln
- 4734 Amhurst Cir
- 200 Wekiva Cove
- 4713 Seastar Vista
- 4795 Bonaire Cay
- 4789 Bonaire Cay
- 272 Calusa Blvd
- 270 Calusa Blvd
- 4720 Rendezvous Cove
- 4507 Furling Ln Unit 208
- 4507 Furling Ln Unit STE 212
- 4507 Furling Ln
- 4507 Furling Ln Unit STE 104
- 4507 Furling Ln Unit s 103 & 202
- 4507 Furling Ln Unit 101
- 4507 Furling Ln Unit 102
- 4507 Furling Ln Unit 207
- 4507 Furling Ln Unit 214
- 4507 Furling Ln Unit 111
- 4507 Furling Ln Unit 115
- 4507 Furling Ln Unit 114
- 4507 Furling Ln Unit 115 & 116
- 4507 Furling Ln Unit 106
- 4507 Furling Ln Unit 107
- 4507 Furling Ln Unit 105
- 4507 Furling Ln Unit 204
- 4507 Furling Ln Unit 203
- 4507 Furling Ln Unit 108
- 4507 Furling Ln Unit 213