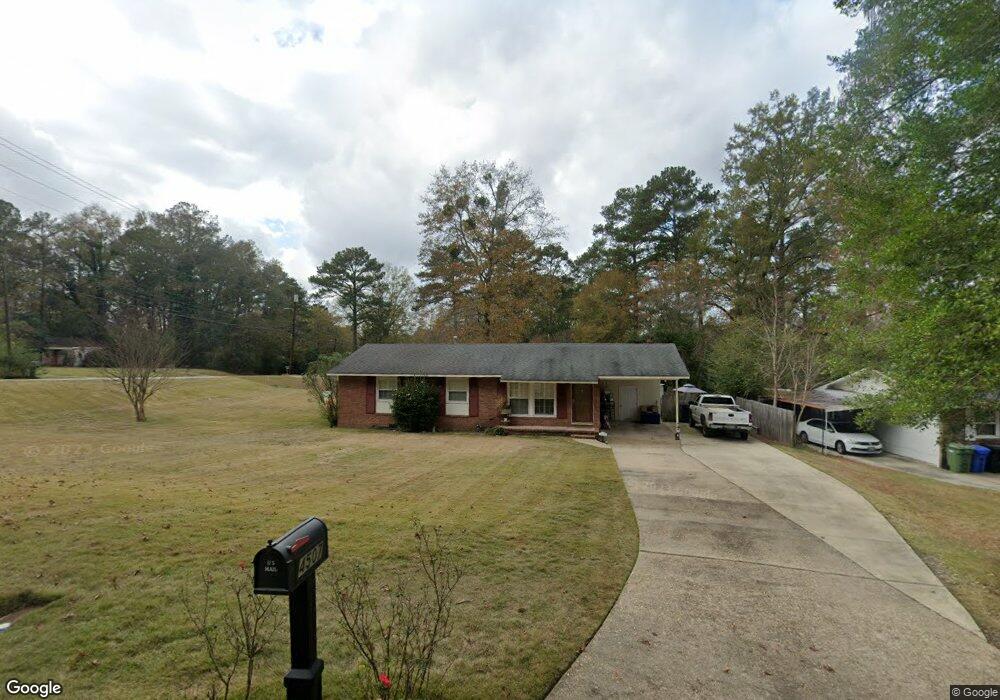
4507 Northgate Dr Columbus, GA 31907
North Columbus NeighborhoodEstimated Value: $83,000 - $166,000
3
Beds
2
Baths
1,075
Sq Ft
$127/Sq Ft
Est. Value
About This Home
This home is located at 4507 Northgate Dr, Columbus, GA 31907 and is currently estimated at $136,627, approximately $127 per square foot. 4507 Northgate Dr is a home located in Muscogee County with nearby schools including Reese Road Leadership Academy, Fort Middle School, and Hardaway High School.
Ownership History
Date
Name
Owned For
Owner Type
Purchase Details
Closed on
Nov 15, 2022
Sold by
Hancock Angela
Bought by
Hancock Larry S and Hancock Rebecca L
Current Estimated Value
Home Financials for this Owner
Home Financials are based on the most recent Mortgage that was taken out on this home.
Original Mortgage
$111,000
Outstanding Balance
$107,552
Interest Rate
6.94%
Mortgage Type
VA
Estimated Equity
$29,075
Purchase Details
Closed on
Nov 8, 2022
Sold by
Hancock Terry
Bought by
Hancock Angela
Home Financials for this Owner
Home Financials are based on the most recent Mortgage that was taken out on this home.
Original Mortgage
$111,000
Outstanding Balance
$107,552
Interest Rate
6.94%
Mortgage Type
VA
Estimated Equity
$29,075
Purchase Details
Closed on
Sep 10, 2020
Sold by
Wells Jackson Thomas
Bought by
Hancock Terry and Hancock Angela
Purchase Details
Closed on
Jul 30, 2019
Sold by
Hancock Terry
Bought by
Wells Jackson Thomas
Create a Home Valuation Report for This Property
The Home Valuation Report is an in-depth analysis detailing your home's value as well as a comparison with similar homes in the area
Home Values in the Area
Average Home Value in this Area
Purchase History
| Date | Buyer | Sale Price | Title Company |
|---|---|---|---|
| Hancock Larry S | $111,000 | -- | |
| Hancock Angela | -- | -- | |
| Hancock Terry | -- | -- | |
| Wells Jackson Thomas | -- | -- |
Source: Public Records
Mortgage History
| Date | Status | Borrower | Loan Amount |
|---|---|---|---|
| Open | Hancock Larry S | $111,000 |
Source: Public Records
Tax History
| Year | Tax Paid | Tax Assessment Tax Assessment Total Assessment is a certain percentage of the fair market value that is determined by local assessors to be the total taxable value of land and additions on the property. | Land | Improvement |
|---|---|---|---|---|
| 2025 | -- | $37,368 | $7,560 | $29,808 |
| 2024 | -- | $37,368 | $7,560 | $29,808 |
| 2023 | $1,472 | $37,368 | $7,560 | $29,808 |
| 2022 | $593 | $40,080 | $7,560 | $32,520 |
| 2021 | $587 | $27,760 | $7,560 | $20,200 |
| 2020 | $1,134 | $27,760 | $7,560 | $20,200 |
| 2019 | $591 | $27,760 | $7,560 | $20,200 |
| 2018 | $1,137 | $27,760 | $7,560 | $20,200 |
| 2017 | $1,252 | $30,472 | $7,560 | $22,912 |
| 2016 | $1,799 | $43,600 | $5,125 | $38,475 |
| 2015 | $1,801 | $43,600 | $5,125 | $38,475 |
| 2014 | $1,803 | $43,600 | $5,125 | $38,475 |
| 2013 | -- | $43,600 | $5,125 | $38,475 |
Source: Public Records
Map
Nearby Homes
- 4285 Deanery Ct
- 4418 Hedingham Ln
- 4630 Marie Ave
- 4975 Glacier Dr
- 1 Hiddenwoods Ct
- 4402 Dunstan Ct
- 5002 Sears Ct
- 4220 King Arthur Place
- 5505 River Rock Ct
- 4732 Delfair Dr
- 4032 Pickering Dr
- 5142 Durban Ct
- 5065 Pond View Dr
- 4102 Norwood Dr
- 2963 Grant Rd
- 4520 Marci Ct
- 4027 Savannah Dr
- 4657 Bondale Dr
- 4004 Tifton Dr
- 5302 Pine Needle Dr
- 4515 Northgate Dr
- 4623 Reese Rd
- 4617 Reese Rd
- 4622 Gregory Dr
- 4630 Gregory Dr
- 4433 Reese Rd
- 4616 Gregory Dr
- 4624 Reese Rd
- 4611 Reese Rd
- 4431 Reese Rd
- 4620 Reese Rd
- 4612 Gregory Dr
- 4605 Reese Rd
- 4423 Reese Rd
- 4629 Gregory Dr
- 4610 Reese Rd Unit 114C
- 4610 Reese Rd
- 4617 Gregory Dr
- 4535 Reese Rd
- 4413 Reese Rd
Your Personal Tour Guide
Ask me questions while you tour the home.