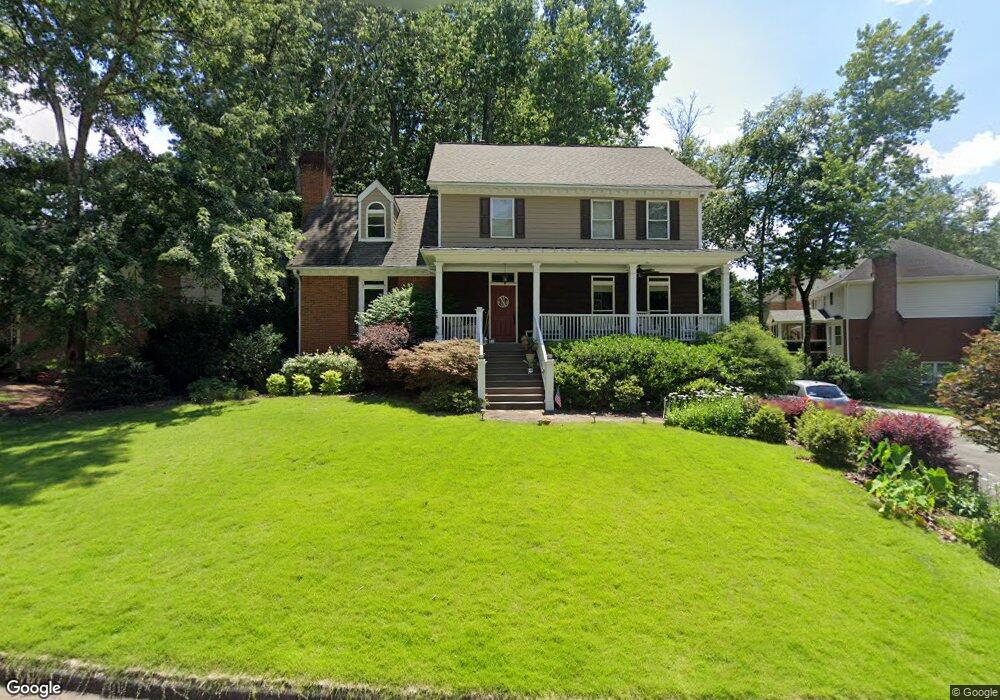
4507 Stilson Cir Unit 13 Norcross, GA 30092
Estimated Value: $620,593 - $730,000
4
Beds
3
Baths
2,532
Sq Ft
$270/Sq Ft
Est. Value
About This Home
This home is located at 4507 Stilson Cir Unit 13, Norcross, GA 30092 and is currently estimated at $682,648, approximately $269 per square foot. 4507 Stilson Cir Unit 13 is a home located in Gwinnett County with nearby schools including Simpson Elementary School, Pinckneyville Middle School, and Norcross High School.
Ownership History
Date
Name
Owned For
Owner Type
Purchase Details
Closed on
Jun 5, 2020
Sold by
Salazar Audra
Bought by
Nelkin Joshua and Nelkin Nuria
Current Estimated Value
Home Financials for this Owner
Home Financials are based on the most recent Mortgage that was taken out on this home.
Original Mortgage
$437,000
Outstanding Balance
$296,888
Interest Rate
3.2%
Mortgage Type
New Conventional
Estimated Equity
$385,760
Purchase Details
Closed on
Jul 15, 1999
Sold by
Mccall Sean P and Mccall Barbara A
Bought by
Salazar Audra and Salazar Raymond
Home Financials for this Owner
Home Financials are based on the most recent Mortgage that was taken out on this home.
Original Mortgage
$227,250
Interest Rate
7.51%
Mortgage Type
New Conventional
Purchase Details
Closed on
Jun 22, 1995
Sold by
Smith W Robert Rebecca M
Bought by
Mccall Sean P Barbara A
Create a Home Valuation Report for This Property
The Home Valuation Report is an in-depth analysis detailing your home's value as well as a comparison with similar homes in the area
Home Values in the Area
Average Home Value in this Area
Purchase History
| Date | Buyer | Sale Price | Title Company |
|---|---|---|---|
| Nelkin Joshua | $460,000 | -- | |
| Salazar Audra | $252,500 | -- | |
| Mccall Sean P Barbara A | $193,000 | -- |
Source: Public Records
Mortgage History
| Date | Status | Borrower | Loan Amount |
|---|---|---|---|
| Open | Nelkin Joshua | $437,000 | |
| Previous Owner | Salazar Audra | $227,250 | |
| Closed | Mccall Sean P Barbara A | $0 |
Source: Public Records
Tax History Compared to Growth
Tax History
| Year | Tax Paid | Tax Assessment Tax Assessment Total Assessment is a certain percentage of the fair market value that is determined by local assessors to be the total taxable value of land and additions on the property. | Land | Improvement |
|---|---|---|---|---|
| 2025 | $7,618 | $253,240 | $50,160 | $203,080 |
| 2024 | $7,255 | $228,480 | $44,000 | $184,480 |
| 2023 | $7,255 | $228,480 | $44,000 | $184,480 |
| 2022 | $6,837 | $207,720 | $36,000 | $171,720 |
| 2021 | $6,338 | $167,640 | $35,520 | $132,120 |
| 2020 | $5,034 | $167,640 | $35,520 | $132,120 |
| 2019 | $4,623 | $154,000 | $30,000 | $124,000 |
| 2018 | $4,640 | $154,000 | $30,000 | $124,000 |
| 2016 | $4,186 | $134,800 | $24,000 | $110,800 |
| 2015 | $4,225 | $134,800 | $24,000 | $110,800 |
| 2014 | $4,107 | $134,800 | $24,000 | $110,800 |
Source: Public Records
Map
Nearby Homes
- 5221 W Jones Bridge Rd
- 5350 Wickershire Dr
- 5397 Valley Mist Ct
- 5354 Fox Hill Dr
- 5545 Fitzpatrick Terrace
- 4531 Outer Bank Dr
- 5465 Fort Fisher Way
- 5465 Fort Fisher Way
- 5440 Clinchfield Trail
- 4916 Sudbrook Way Unit 253
- The Adams Plan at Waterside - Condos
- 4457 Watervale Way Unit 292
- 4477 Watervale Way Unit 286
- 5047 Shirley Oaks Dr Unit 313
- 4903 Sudbrook Way Unit 239
- The Stanley Plan at Waterside - Single Family
- The Stafford Plan at Waterside - Single Family
- 5039 Shirley Oaks Dr Unit 315
- 4479 Watervale Way Unit 285
- 5059 Shirley Oaks Dr Unit 309
- 4487 Stilson Cir
- 4527 Stilson Cir
- 4457 Stilson Cir Unit 13
- 4537 Stilson Cir Unit 13
- 4506 Stilson Cir
- 4516 Stilson Cir
- 4447 Stilson Cir
- 4496 Stilson Cir Unit 13
- 5469 Portal Place Unit 13
- 4526 Stilson Cir
- 4486 Stilson Cir
- 5459 Portal Place Unit 13
- 4536 Stilson Cir Unit 13
- 4466 Stilson Cir
- 5479 Portal Place
- 4437 Stilson Cir
- 4456 Stilson Cir
- 4360 Doerun Ct
- 5364 Valley Mist Trace
- 4361 Doerun Ct