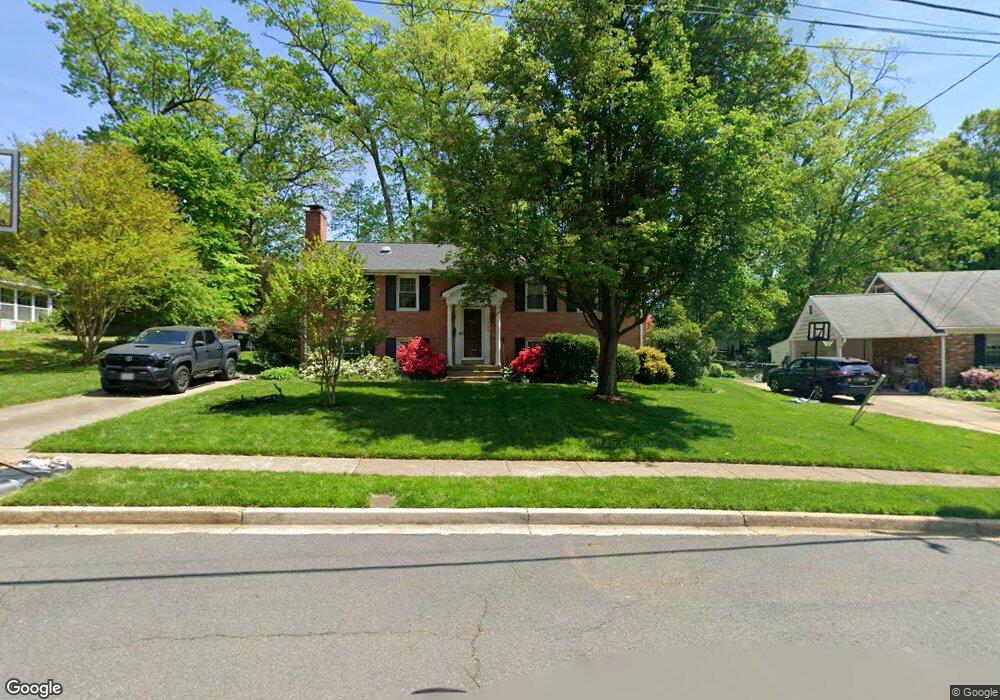
4507 Tempest Place Annandale, VA 22003
Estimated Value: $828,562 - $915,000
4
Beds
3
Baths
1,334
Sq Ft
$654/Sq Ft
Est. Value
About This Home
This home is located at 4507 Tempest Place, Annandale, VA 22003 and is currently estimated at $871,891, approximately $653 per square foot. 4507 Tempest Place is a home located in Fairfax County with nearby schools including Wakefield Forest Elementary School, Frost Middle School, and W. T. Woodson High School.
Ownership History
Date
Name
Owned For
Owner Type
Purchase Details
Closed on
Nov 27, 2018
Sold by
Erb Matthew and Chunephisal Alisa
Bought by
Erb Matthew
Current Estimated Value
Home Financials for this Owner
Home Financials are based on the most recent Mortgage that was taken out on this home.
Original Mortgage
$492,500
Outstanding Balance
$433,903
Interest Rate
4.8%
Mortgage Type
New Conventional
Estimated Equity
$437,988
Purchase Details
Closed on
May 18, 2010
Sold by
Zhang Qi and Xing Hongtao
Bought by
Erb Matthew and Chunephisal Alisa
Home Financials for this Owner
Home Financials are based on the most recent Mortgage that was taken out on this home.
Original Mortgage
$454,313
Interest Rate
5.23%
Mortgage Type
FHA
Purchase Details
Closed on
Jun 17, 1999
Sold by
Davis Robert S
Bought by
Zhang Qi
Home Financials for this Owner
Home Financials are based on the most recent Mortgage that was taken out on this home.
Original Mortgage
$188,000
Interest Rate
7.09%
Create a Home Valuation Report for This Property
The Home Valuation Report is an in-depth analysis detailing your home's value as well as a comparison with similar homes in the area
Home Values in the Area
Average Home Value in this Area
Purchase History
| Date | Buyer | Sale Price | Title Company |
|---|---|---|---|
| Erb Matthew | -- | Westcor Land Title Ins Co | |
| Erb Matthew | $470,000 | -- | |
| Zhang Qi | $237,250 | -- |
Source: Public Records
Mortgage History
| Date | Status | Borrower | Loan Amount |
|---|---|---|---|
| Open | Erb Matthew | $492,500 | |
| Previous Owner | Erb Matthew | $454,313 | |
| Previous Owner | Zhang Qi | $188,000 |
Source: Public Records
Tax History Compared to Growth
Tax History
| Year | Tax Paid | Tax Assessment Tax Assessment Total Assessment is a certain percentage of the fair market value that is determined by local assessors to be the total taxable value of land and additions on the property. | Land | Improvement |
|---|---|---|---|---|
| 2025 | $8,337 | $790,510 | $306,000 | $484,510 |
| 2024 | $8,337 | $719,620 | $271,000 | $448,620 |
| 2023 | $7,939 | $703,470 | $261,000 | $442,470 |
| 2022 | $7,533 | $658,790 | $251,000 | $407,790 |
| 2021 | $7,295 | $621,670 | $221,000 | $400,670 |
| 2020 | $7,076 | $597,890 | $221,000 | $376,890 |
| 2019 | $6,893 | $582,390 | $221,000 | $361,390 |
| 2018 | $6,697 | $582,390 | $221,000 | $361,390 |
| 2017 | $6,299 | $542,580 | $210,000 | $332,580 |
| 2016 | $6,164 | $532,060 | $206,000 | $326,060 |
| 2015 | $5,938 | $532,060 | $206,000 | $326,060 |
| 2014 | $5,770 | $518,180 | $206,000 | $312,180 |
Source: Public Records
Map
Nearby Homes
- 4504 Wakefield Dr
- 8928 Cheltonham Place
- 4353 Starr Jordan Dr
- 4721 Springbrook Dr
- 4024 Iva Ln
- 9017 Ellenwood Ln
- 9216 Kristin Ln
- 8920 Walker St
- 4301 Braeburn Dr
- 4903 King David Blvd
- 5009 King David Blvd
- 9117 Hunting Pines Place
- 5112 Linette Ln
- 4222 Braeburn Dr
- 9207 Hunting Pines Place
- 9308 Ashmeade Dr
- 8502 Woodbine Ln
- 8312 Upper Spring Ln
- 8310 Upper Spring Ln
- 4307 Planters Ct
- 4505 Tempest Place
- 4509 Tempest Place
- 4506 Mullen Ln
- 4508 Mullen Ln
- 4508 Tempest Place
- 4504 Mullen Ln
- 4510 Mullen Ln
- 4503 Tempest Place
- 4511 Tempest Place
- 4506 Tempest Place
- 4512 Tempest Place
- 4502 Mullen Ln
- 4504 Tempest Place
- 4512 Mullen Ln
- 8904 Stark Rd
- 4505 Mullen Ln
- 4501 Tempest Place
- 4513 Tempest Place
- 4507 Mullen Ln
- 8908 Stark Rd