4508 Orangefield Rd Unit Bridge City Orange, TX 77630
East Orange NeighborhoodEstimated Value: $112,000 - $165,000
2
Beds
1
Bath
1,134
Sq Ft
$124/Sq Ft
Est. Value
About This Home
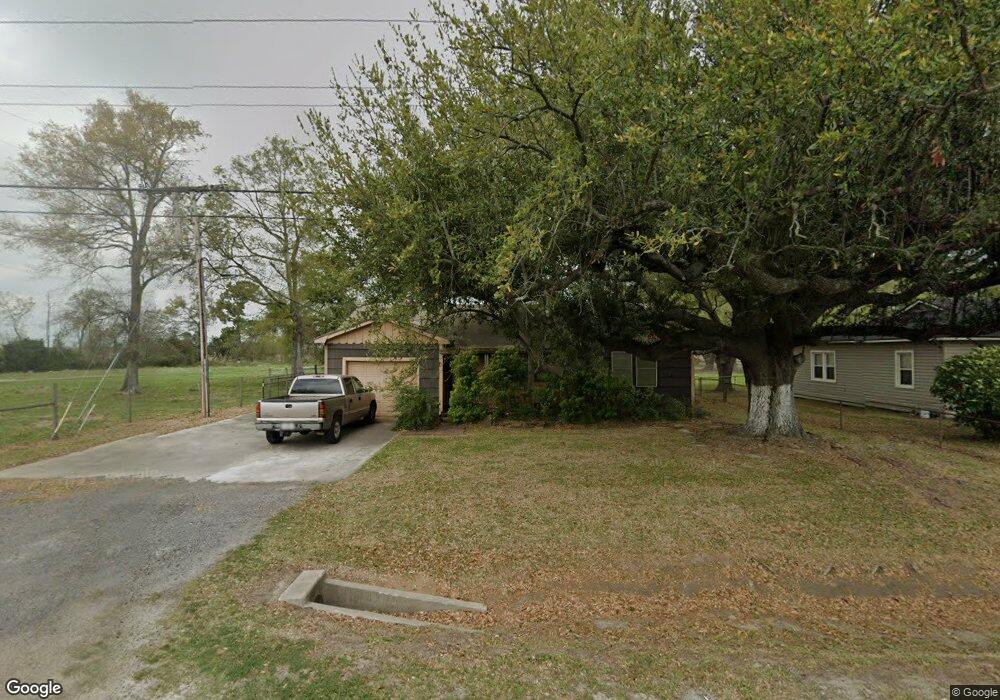
This home is located at 4508 Orangefield Rd Unit Bridge City, Orange, TX 77630 and is currently estimated at $140,064, approximately $123 per square foot. 4508 Orangefield Rd Unit Bridge City is a home located in Orange County with nearby schools including Bridge City Elementary School, Bridge City Intermediate School, and Bridge City Middle School.
Ownership History
Date
Name
Owned For
Owner Type
Purchase Details
Closed on
Feb 23, 2023
Sold by
Landry Justin Mikeal
Bought by
Jones Charles A
Current Estimated Value
Home Financials for this Owner
Home Financials are based on the most recent Mortgage that was taken out on this home.
Original Mortgage
$104,900
Outstanding Balance
$97,569
Interest Rate
6.33%
Mortgage Type
Seller Take Back
Estimated Equity
$42,495
Purchase Details
Closed on
Sep 9, 2019
Sold by
Landry Christopher
Bought by
Landry Justin
Purchase Details
Closed on
Aug 14, 2015
Sold by
Landry Warren J and Harper Donna Gail
Bought by
Landry Christopher Joseph
Purchase Details
Closed on
Apr 23, 2014
Sold by
Landry Warren J
Bought by
Landry Warren J
Purchase Details
Closed on
Jan 11, 2007
Sold by
Heringer Clara B
Bought by
Landry Warren J and Landry Dorothy Mae
Create a Home Valuation Report for This Property
The Home Valuation Report is an in-depth analysis detailing your home's value as well as a comparison with similar homes in the area
Home Values in the Area
Average Home Value in this Area
Purchase History
| Date | Buyer | Sale Price | Title Company |
|---|---|---|---|
| Jones Charles A | -- | Capital Title | |
| Landry Justin | -- | None Available | |
| Landry Christopher Joseph | -- | None Available | |
| Landry Warren J | -- | None Available | |
| Landry Warren J | -- | James R Dunaway Pc | |
| Landry Christopher Joseph | -- | -- |
Source: Public Records
Mortgage History
| Date | Status | Borrower | Loan Amount |
|---|---|---|---|
| Open | Jones Charles A | $104,900 |
Source: Public Records
Tax History Compared to Growth
Tax History
| Year | Tax Paid | Tax Assessment Tax Assessment Total Assessment is a certain percentage of the fair market value that is determined by local assessors to be the total taxable value of land and additions on the property. | Land | Improvement |
|---|---|---|---|---|
| 2024 | $2,747 | $112,454 | $7,500 | $104,954 |
| 2023 | $2,495 | $102,461 | $7,500 | $94,961 |
| 2022 | $2,377 | $94,620 | $7,500 | $87,120 |
| 2021 | $2,171 | $84,560 | $7,500 | $77,060 |
| 2020 | $1,917 | $74,110 | $7,500 | $66,610 |
| 2019 | $1,838 | $69,209 | $7,500 | $61,709 |
| 2018 | $1,678 | $65,858 | $7,500 | $58,358 |
| 2017 | $1,678 | $65,858 | $7,500 | $58,358 |
| 2016 | $1,571 | $61,537 | $7,500 | $54,037 |
| 2015 | $394 | $60,061 | $7,500 | $52,561 |
| 2014 | $394 | $59,088 | $7,500 | $51,588 |
Source: Public Records
Map
Nearby Homes
- 607 Cypress Wood Dr
- 326 S 44th St
- 4438 W Edgar St
- 4409 Persimmon Cir
- 4403 Persimmon Cir
- 1150 Cypress Wood Dr
- 1150 Cypress Wood Dr Unit Hwy. 87
- tbd Bessie Heights
- 0000 Bentwood
- 000 Jackie St
- 1109 Cypresswood Dr
- 601 Greenbriar St
- 4215 Tulane Rd
- 0000 Hwy 105
- 306 308 Old Timers Rd
- 8225 Tulane Rd
- 3726 Edgemont Dr
- 3615 Edgemont Dr
- 0 Bowling Ln
- 3402 Edgar Brown Dr
- 4508 Orangefield Rd
- 4502 Orangefield Rd
- 512 S 44th St
- 512 S 44th St Unit Income Producing Pro
- 512 S 44th St Unit BCISD!
- 4448 Orangefield Rd
- 502 S 44th St
- 507 S 44th St
- 500 S 44th St
- 4433 Gladys Ave
- 604 Cypresswood Dr
- 601 Cypress Wood Dr
- 4436 Orangefield Rd
- 4450 Gladys Ave
- 603 Cypress Wood Dr
- 414 S 44th St
- 600 Woodway Dr
- 4431 Gladys Ave
- 606 Cypress Wood Dr
- 4444 Gladys Ave