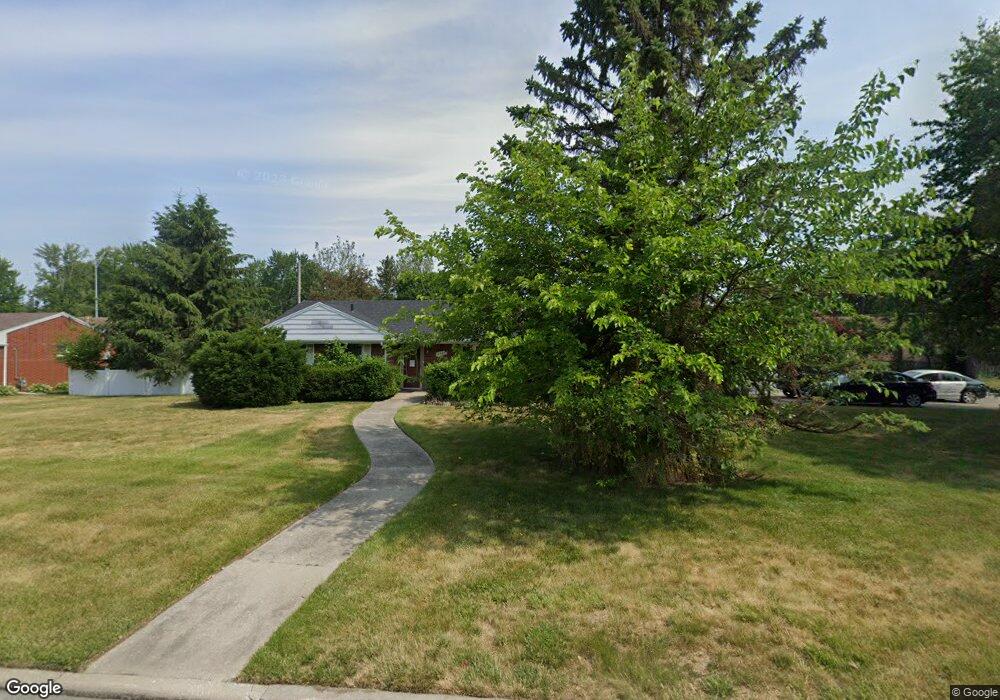
4508 Springbrook Dr Toledo, OH 43615
Estimated Value: $237,672 - $283,000
4
Beds
2
Baths
1,943
Sq Ft
$133/Sq Ft
Est. Value
About This Home
This home is located at 4508 Springbrook Dr, Toledo, OH 43615 and is currently estimated at $257,668, approximately $132 per square foot. 4508 Springbrook Dr is a home located in Lucas County with nearby schools including Whiteford Elementary School, Sylvania Arbor Hills Junior High School, and Sylvania Southview High School.
Ownership History
Date
Name
Owned For
Owner Type
Purchase Details
Closed on
Mar 5, 2018
Sold by
Mccoy Norma L and Metropolitan Iife Insurance Co
Bought by
Mahmoud Radwan M and Ragab Soma A
Current Estimated Value
Home Financials for this Owner
Home Financials are based on the most recent Mortgage that was taken out on this home.
Original Mortgage
$97,000
Outstanding Balance
$82,454
Interest Rate
4.32%
Mortgage Type
New Conventional
Estimated Equity
$175,214
Purchase Details
Closed on
Oct 24, 2017
Sold by
Gasior Charles V and Mccoy Glenn Dean
Bought by
Gasior Charles V
Purchase Details
Closed on
Jul 31, 2003
Sold by
Crabtree Brenda J
Bought by
Mccoy Glenda D and Mccoy Norma L
Purchase Details
Closed on
Jul 1, 1996
Sold by
Weston Ovel
Bought by
Crabtree Brenda J
Home Financials for this Owner
Home Financials are based on the most recent Mortgage that was taken out on this home.
Original Mortgage
$74,000
Interest Rate
8.13%
Mortgage Type
New Conventional
Create a Home Valuation Report for This Property
The Home Valuation Report is an in-depth analysis detailing your home's value as well as a comparison with similar homes in the area
Home Values in the Area
Average Home Value in this Area
Purchase History
| Date | Buyer | Sale Price | Title Company |
|---|---|---|---|
| Mahmoud Radwan M | $100,000 | None Available | |
| Gasior Charles V | -- | None Available | |
| Mccoy Glenda D | $155,900 | Northwest Title Agency Of Oh | |
| Crabtree Brenda J | $92,500 | -- |
Source: Public Records
Mortgage History
| Date | Status | Borrower | Loan Amount |
|---|---|---|---|
| Open | Mahmoud Radwan M | $97,000 | |
| Previous Owner | Crabtree Brenda J | $74,000 |
Source: Public Records
Tax History
| Year | Tax Paid | Tax Assessment Tax Assessment Total Assessment is a certain percentage of the fair market value that is determined by local assessors to be the total taxable value of land and additions on the property. | Land | Improvement |
|---|---|---|---|---|
| 2025 | -- | $48,650 | $9,765 | $38,885 |
| 2024 | $1,527 | $48,650 | $9,765 | $38,885 |
| 2023 | $3,063 | $41,860 | $7,420 | $34,440 |
| 2022 | $3,059 | $41,860 | $7,420 | $34,440 |
| 2021 | $3,162 | $41,860 | $7,420 | $34,440 |
| 2020 | $3,139 | $35,805 | $6,090 | $29,715 |
| 2019 | $3,061 | $35,805 | $6,090 | $29,715 |
| 2018 | $3,079 | $35,805 | $6,090 | $29,715 |
| 2017 | $2,433 | $34,650 | $6,755 | $27,895 |
| 2016 | $2,454 | $99,000 | $19,300 | $79,700 |
| 2015 | $2,332 | $99,000 | $19,300 | $79,700 |
| 2014 | $1,897 | $34,660 | $6,760 | $27,900 |
| 2013 | $1,897 | $34,660 | $6,760 | $27,900 |
Source: Public Records
Map
Nearby Homes
- 4735 Imperial Dr
- 4770 Springbrook Dr
- 4108 Partridge Ln
- 3945 Imperial Blvd
- 4906 Pine Ridge Rd
- 3521 Southpoint Rd
- 3205 Talmadge Rd
- 4608 Breckenridge Dr
- 4426 Rose Garden Dr
- 4420 Rose Garden Dr
- 3660 W Lincolnshire Blvd
- 3446 Stanhope Dr
- 4550 Vineyard Rd
- 5021 Rudgate Blvd
- 3723 Manchester Blvd
- 3127 Evergreen Rd
- 2949 Secretariat Rd
- 4737 Sadalia Rd
- 4842 Larkhaven Dr
- 4727 Clover Ln
- 4518 Springbrook Dr
- 4462 Springbrook Dr
- 3743 Coronada Dr
- 3744 Shamrock Dr
- 4528 Springbrook Dr
- 3744 Coronada Dr
- 4452 Springbrook Dr
- 3733 Coronada Dr
- 3734 Shamrock Dr
- 4538 Springbrook Dr
- 4519 Imperial Dr
- 4515 Imperial Dr
- 3743 Shamrock Dr
- 4509 Imperial Dr
- 3734 Coronada Dr
- 3743 Westchester Rd
- 4531 Imperial Dr
- 4503 Imperial Dr
- 4442 Springbrook Dr
- 4535 Imperial Dr
Your Personal Tour Guide
Ask me questions while you tour the home.