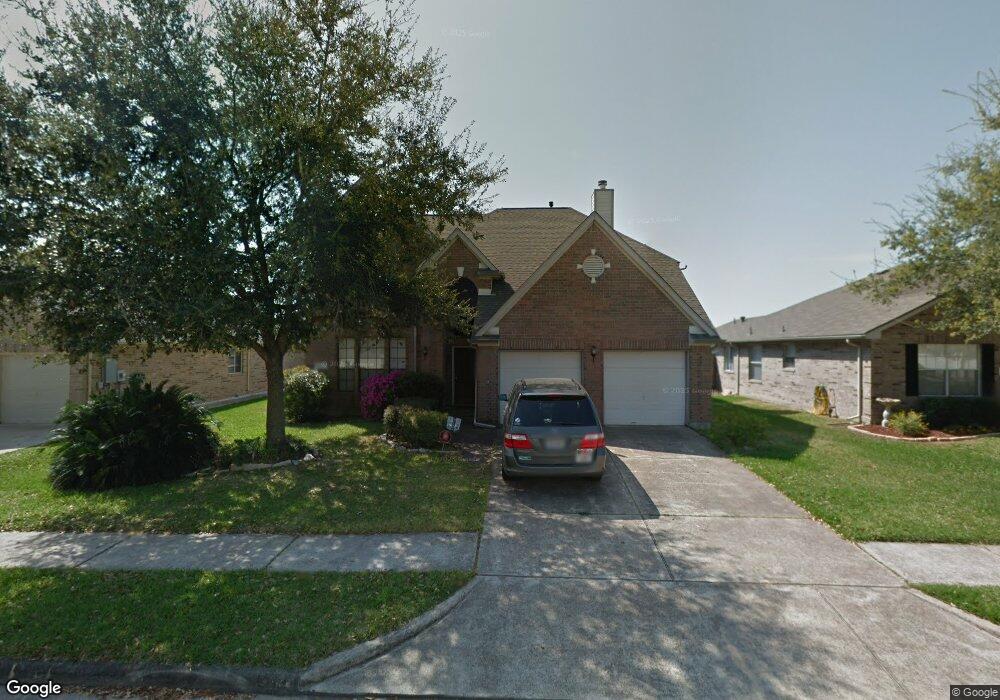
4508 Teal Glen St Pearland, TX 77584
Estimated Value: $311,000 - $369,000
3
Beds
3
Baths
2,572
Sq Ft
$131/Sq Ft
Est. Value
About This Home
This home is located at 4508 Teal Glen St, Pearland, TX 77584 and is currently estimated at $336,050, approximately $130 per square foot. 4508 Teal Glen St is a home located in Brazoria County with nearby schools including Magnolia Elementary School, Pearland Junior High School South, and Sam Jamison Middle School.
Ownership History
Date
Name
Owned For
Owner Type
Purchase Details
Closed on
Jun 14, 2019
Sold by
Brisbay Brittany Nicole and Stanton Christopher Robert
Bought by
Stanton Christopher Robert and Stanton Brittany Nicole
Current Estimated Value
Purchase Details
Closed on
Jan 19, 2012
Sold by
Grubbs Wendee R and Grubbs Gregg A
Bought by
Stanton Christopher Robert and Brisbay Brittany Nicole
Home Financials for this Owner
Home Financials are based on the most recent Mortgage that was taken out on this home.
Original Mortgage
$142,639
Outstanding Balance
$97,273
Interest Rate
3.87%
Mortgage Type
FHA
Estimated Equity
$238,777
Purchase Details
Closed on
Feb 26, 2001
Sold by
Berry Michael William and Berry Kimberly Rea
Bought by
Grubbs Wendee R and Grubbs Gregg A
Home Financials for this Owner
Home Financials are based on the most recent Mortgage that was taken out on this home.
Original Mortgage
$137,702
Interest Rate
6.97%
Create a Home Valuation Report for This Property
The Home Valuation Report is an in-depth analysis detailing your home's value as well as a comparison with similar homes in the area
Home Values in the Area
Average Home Value in this Area
Purchase History
| Date | Buyer | Sale Price | Title Company |
|---|---|---|---|
| Stanton Christopher Robert | -- | None Available | |
| Stanton Christopher Robert | -- | Stewart Title | |
| Grubbs Wendee R | -- | Texas American Title Company |
Source: Public Records
Mortgage History
| Date | Status | Borrower | Loan Amount |
|---|---|---|---|
| Open | Stanton Christopher Robert | $142,639 | |
| Previous Owner | Grubbs Wendee R | $137,702 |
Source: Public Records
Tax History Compared to Growth
Tax History
| Year | Tax Paid | Tax Assessment Tax Assessment Total Assessment is a certain percentage of the fair market value that is determined by local assessors to be the total taxable value of land and additions on the property. | Land | Improvement |
|---|---|---|---|---|
| 2025 | $5,300 | $339,129 | $23,100 | $319,580 |
| 2023 | $5,300 | $280,272 | $23,100 | $288,150 |
| 2022 | $6,129 | $254,793 | $23,100 | $252,480 |
| 2021 | $5,968 | $231,630 | $23,100 | $208,530 |
| 2020 | $5,702 | $231,630 | $23,100 | $208,530 |
| 2019 | $5,185 | $193,210 | $20,090 | $173,120 |
| 2018 | $4,693 | $174,670 | $20,090 | $154,580 |
| 2017 | $5,171 | $191,520 | $20,090 | $171,430 |
| 2016 | $4,844 | $179,390 | $20,090 | $159,300 |
| 2014 | $4,257 | $153,020 | $20,090 | $132,930 |
Source: Public Records
Map
Nearby Homes
- 3307 Norma Ln
- 4806 Chaperel Dr
- 4967 Millican Dr
- 3703 Canterbury Park Dr
- 3705 Canterbury Park Dr
- 3804 Parry Fields Ct
- 3910 Greenwood Dr
- 3806 Canterbury Park Dr
- 3509 Pentland Downs St
- 4015 Cedarwood Dr
- 4013 Ivywood Dr
- 3911 Spring Garden Dr
- 5301 Ryan Acres Dr
- 5205 Spring Branch Dr
- 5109 Playa Dr
- 17827 Texas 35
- 3602 Lindhaven Dr
- 4505 Cedar Hill Dr
- 5101 Big Spring Dr
- 4610 Meridian Park Dr
- 4506 Teal Glen St
- 4510 Teal Glen St
- 4409 Sebago Ct
- 4504 Teal Glen St
- 4512 Teal Glen St
- 4411 Sebago Ct
- 4505 Teal Glen St
- 4503 Teal Glen St
- 4405 Sebago Ct
- 4407 Sebago Ct
- 4507 Teal Glen St
- 4413 Sebago Ct
- 4501 Teal Glen St
- 4514 Teal Glen St
- 4509 Teal Glen St
- 4502 Teal Glen St
- 3607 Teal Glen St
- 4506 Stonebridge Dr
- 4504 Stonebridge Dr
- 4403 Sebago Ct