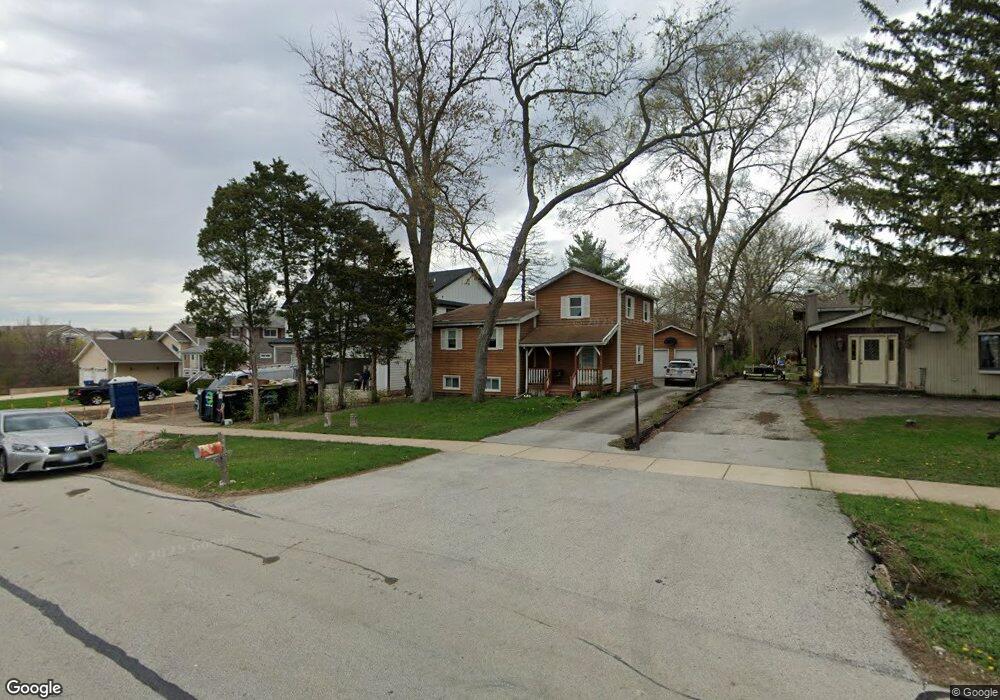
4509 Drendel Rd Downers Grove, IL 60515
Belmont NeighborhoodEstimated Value: $286,000 - $356,000
--
Bed
--
Bath
1,269
Sq Ft
$254/Sq Ft
Est. Value
About This Home
This home is located at 4509 Drendel Rd, Downers Grove, IL 60515 and is currently estimated at $321,738, approximately $253 per square foot. 4509 Drendel Rd is a home located in DuPage County with nearby schools including Henry Puffer School, Herrick Middle School, and Downer Grove North High School.
Ownership History
Date
Name
Owned For
Owner Type
Purchase Details
Closed on
May 14, 2005
Sold by
Anderson Corey L
Bought by
Anderson Corey L and Anderson Katerina J
Current Estimated Value
Home Financials for this Owner
Home Financials are based on the most recent Mortgage that was taken out on this home.
Original Mortgage
$176,000
Outstanding Balance
$117,019
Interest Rate
10.5%
Mortgage Type
Stand Alone Refi Refinance Of Original Loan
Estimated Equity
$204,719
Purchase Details
Closed on
Oct 30, 1997
Sold by
Anderson Cheryl M
Bought by
Anderson Corey L
Purchase Details
Closed on
Sep 18, 1997
Sold by
Anderson Cheryl M
Bought by
Anderson Corey L
Purchase Details
Closed on
Oct 19, 1993
Sold by
Anderson Cheryl M and Lange Cheryl M
Bought by
Anderson Corey L and Anderson Cheryl M
Home Financials for this Owner
Home Financials are based on the most recent Mortgage that was taken out on this home.
Original Mortgage
$85,000
Interest Rate
7.02%
Create a Home Valuation Report for This Property
The Home Valuation Report is an in-depth analysis detailing your home's value as well as a comparison with similar homes in the area
Home Values in the Area
Average Home Value in this Area
Purchase History
| Date | Buyer | Sale Price | Title Company |
|---|---|---|---|
| Anderson Corey L | -- | Tristar Title Llc | |
| Anderson Corey L | -- | -- | |
| Anderson Corey L | -- | -- | |
| Anderson Corey L | -- | -- |
Source: Public Records
Mortgage History
| Date | Status | Borrower | Loan Amount |
|---|---|---|---|
| Open | Anderson Corey L | $176,000 | |
| Closed | Anderson Corey L | $85,000 |
Source: Public Records
Tax History Compared to Growth
Tax History
| Year | Tax Paid | Tax Assessment Tax Assessment Total Assessment is a certain percentage of the fair market value that is determined by local assessors to be the total taxable value of land and additions on the property. | Land | Improvement |
|---|---|---|---|---|
| 2024 | $4,786 | $91,677 | $53,470 | $38,207 |
| 2023 | $4,507 | $83,670 | $48,800 | $34,870 |
| 2022 | $4,169 | $76,840 | $44,820 | $32,020 |
| 2021 | $3,794 | $73,930 | $43,120 | $30,810 |
| 2020 | $3,729 | $72,600 | $42,340 | $30,260 |
| 2019 | $3,595 | $69,460 | $40,510 | $28,950 |
| 2018 | $3,386 | $64,920 | $37,860 | $27,060 |
| 2017 | $3,287 | $62,730 | $36,580 | $26,150 |
| 2016 | $3,248 | $60,460 | $35,260 | $25,200 |
| 2015 | $3,203 | $56,930 | $33,200 | $23,730 |
| 2014 | $3,075 | $53,450 | $31,170 | $22,280 |
| 2013 | $3,035 | $53,570 | $31,240 | $22,330 |
Source: Public Records
Map
Nearby Homes
- 403 Provence Ct
- 4848 Francisco Ave
- 2209 Arbor Cir Unit 5
- 4424 Arbor Cir Unit 3
- 4512 Wilson Ave
- 4601 Wilson Ave
- 4705 Elm St
- 4432 Cascara Ln
- 4508 Stonewall Ave
- 4408 Stonewall Ave
- 4542 Basswood Dr
- 5300 Walnut Ave Unit 4D
- 4947 Stonewall Ave
- 5540 Walnut Ave Unit 4A
- 5540 Walnut Ave Unit 11B
- 5540 Walnut Ave Unit 15B
- 4721 Saint Joseph Creek Rd Unit 1B
- 4721 Saint Joseph Creek Rd Unit 4A
- 4711 Saint Joseph Creek Rd Unit 4H
- 4522 Lee Ave
- 4513 Drendel Rd
- 4507 Drendel Rd
- 4517 Drendel Rd
- 4505 Drendel Rd
- 4510 Drendel Rd
- 4521 Drendel Rd
- 4508 Drendel Rd
- 2939 Ogden Ave
- 4512 Drendel Rd
- 4516 Drendel Rd
- 4506 Drendel Rd
- 4504 Drendel Rd
- 4520 Drendel Rd
- 4502 Drendel Rd
- 4529 Drendel Rd
- 4524 Drendel Rd
- 4528 Drendel Rd
- 4504 Cross St
- 4512 Cross St
- 4420 Cross St