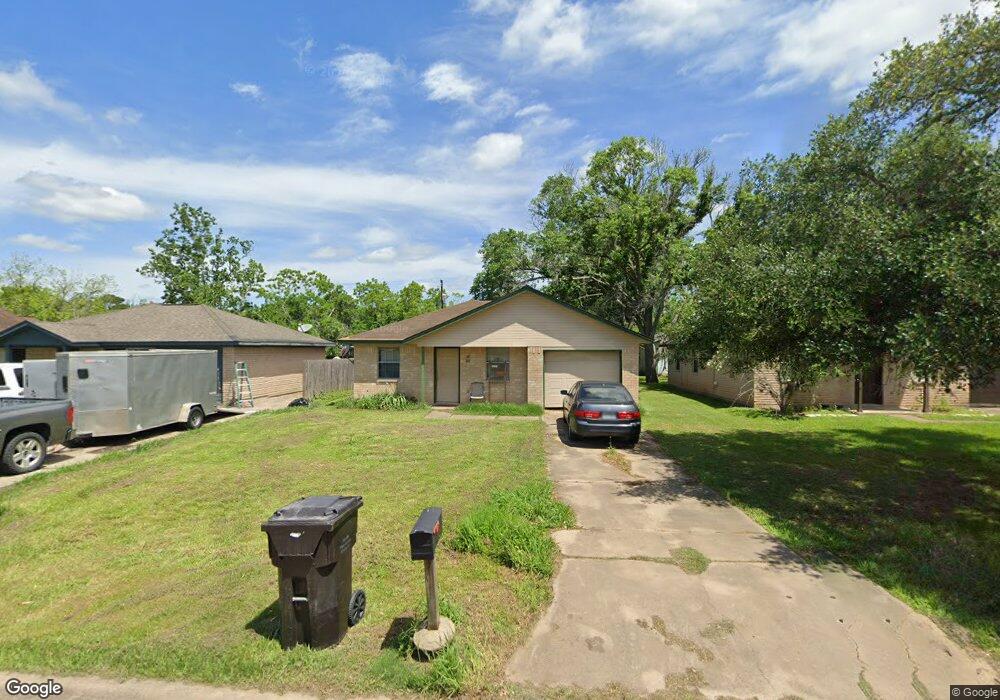
451 Carlton St Brazoria, TX 77422
Estimated Value: $142,000 - $158,000
3
Beds
1
Bath
976
Sq Ft
$155/Sq Ft
Est. Value
About This Home
This home is located at 451 Carlton St, Brazoria, TX 77422 and is currently estimated at $150,873, approximately $154 per square foot. 451 Carlton St is a home located in Brazoria County.
Ownership History
Date
Name
Owned For
Owner Type
Purchase Details
Closed on
May 15, 2006
Sold by
Ohara Patrick J and Ohara Evelyn D
Bought by
Bowie Ii Ernest P and Bowie Krystal N
Current Estimated Value
Home Financials for this Owner
Home Financials are based on the most recent Mortgage that was taken out on this home.
Original Mortgage
$49,600
Outstanding Balance
$28,726
Interest Rate
6.4%
Mortgage Type
Fannie Mae Freddie Mac
Estimated Equity
$122,147
Purchase Details
Closed on
Feb 21, 2003
Sold by
Hannah Jason M
Bought by
Ohara Patrick J and Ohara Evelyn D
Home Financials for this Owner
Home Financials are based on the most recent Mortgage that was taken out on this home.
Original Mortgage
$39,600
Interest Rate
5.93%
Purchase Details
Closed on
Jul 18, 1997
Sold by
Hud
Bought by
Hannah Jason M and Minshew Hannah Lisa A
Home Financials for this Owner
Home Financials are based on the most recent Mortgage that was taken out on this home.
Original Mortgage
$32,730
Interest Rate
7.59%
Mortgage Type
FHA
Purchase Details
Closed on
Aug 6, 1996
Sold by
Stiles R Charles
Bought by
Hud
Create a Home Valuation Report for This Property
The Home Valuation Report is an in-depth analysis detailing your home's value as well as a comparison with similar homes in the area
Home Values in the Area
Average Home Value in this Area
Purchase History
| Date | Buyer | Sale Price | Title Company |
|---|---|---|---|
| Bowie Ii Ernest P | -- | Alamo Title Company | |
| Ohara Patrick J | -- | Stewart Title | |
| Hannah Jason M | $33,000 | -- | |
| Hud | $49,254 | -- |
Source: Public Records
Mortgage History
| Date | Status | Borrower | Loan Amount |
|---|---|---|---|
| Open | Bowie Ii Ernest P | $49,600 | |
| Previous Owner | Ohara Patrick J | $39,600 | |
| Previous Owner | Hannah Jason M | $32,730 |
Source: Public Records
Tax History Compared to Growth
Tax History
| Year | Tax Paid | Tax Assessment Tax Assessment Total Assessment is a certain percentage of the fair market value that is determined by local assessors to be the total taxable value of land and additions on the property. | Land | Improvement |
|---|---|---|---|---|
| 2025 | $981 | $108,983 | $13,880 | $123,400 |
| 2023 | $981 | $90,068 | $12,840 | $115,430 |
| 2022 | $1,849 | $81,880 | $11,330 | $70,550 |
| 2021 | $1,861 | $78,970 | $9,820 | $69,150 |
| 2020 | $1,884 | $84,270 | $9,070 | $75,200 |
| 2019 | $1,767 | $69,220 | $4,910 | $64,310 |
| 2018 | $1,938 | $75,510 | $5,890 | $69,620 |
| 2017 | $1,991 | $75,510 | $5,890 | $69,620 |
| 2016 | $1,810 | $68,730 | $4,910 | $63,820 |
| 2015 | $1,442 | $61,980 | $4,910 | $57,070 |
| 2014 | $1,442 | $66,980 | $4,910 | $62,070 |
Source: Public Records
Map
Nearby Homes
- 409 Carlton St
- 706 E New York St
- 549 E New York St
- 4773 County Road 652
- 232 Magnolia St
- 230 E New York St
- 0 Pecan Dr
- 310 E Texas St
- 401 E Texas St
- 229 Yaupon Dr
- 34654 Fm 521 Rd
- 8922 Fm 521 Rd
- 1208 S Brooks St
- 307 Avenue G
- 523 Lazy Ln
- 0 Cr-747a
- TBD Cr-318
- 320 Cr-320
- 0 Cr-318 Unit 18304666
- TBD Cr-318 Tract 7c