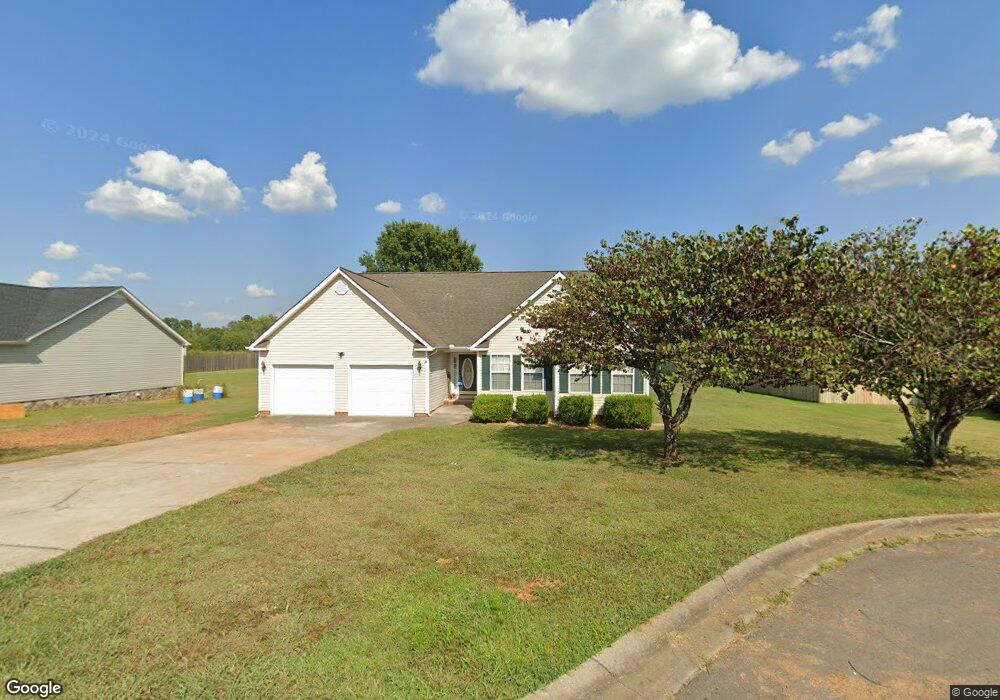
451 Chandlers Ridge Chatsworth, GA 30705
Estimated Value: $263,898 - $342,000
3
Beds
2
Baths
1,700
Sq Ft
$174/Sq Ft
Est. Value
About This Home
This home is located at 451 Chandlers Ridge, Chatsworth, GA 30705 and is currently estimated at $295,975, approximately $174 per square foot. 451 Chandlers Ridge is a home located in Murray County with nearby schools including Woodlawn Elementary School, Bagley Middle School, and North Murray High School.
Ownership History
Date
Name
Owned For
Owner Type
Purchase Details
Closed on
Sep 26, 2006
Sold by
Brock Phillip J
Bought by
Marlow Craig
Current Estimated Value
Home Financials for this Owner
Home Financials are based on the most recent Mortgage that was taken out on this home.
Original Mortgage
$127,800
Outstanding Balance
$75,838
Interest Rate
6.36%
Mortgage Type
New Conventional
Estimated Equity
$220,137
Purchase Details
Closed on
May 1, 2003
Sold by
Arrington William
Bought by
Brock Phillip J and Brock Lisa L
Purchase Details
Closed on
Aug 22, 2002
Sold by
Rainbow Properties
Bought by
Arrington William
Purchase Details
Closed on
Jun 13, 2002
Sold by
Wilbanks Barbara Anne
Bought by
Rainbow Properties
Purchase Details
Closed on
Apr 28, 2000
Bought by
Wilbanks Barbara Anne
Create a Home Valuation Report for This Property
The Home Valuation Report is an in-depth analysis detailing your home's value as well as a comparison with similar homes in the area
Home Values in the Area
Average Home Value in this Area
Purchase History
| Date | Buyer | Sale Price | Title Company |
|---|---|---|---|
| Marlow Craig | $159,750 | -- | |
| Brock Phillip J | $130,000 | -- | |
| Arrington William | $39,000 | -- | |
| Rainbow Properties | $279,000 | -- | |
| Wilbanks Barbara Anne | -- | -- |
Source: Public Records
Mortgage History
| Date | Status | Borrower | Loan Amount |
|---|---|---|---|
| Open | Marlow Craig | $127,800 | |
| Closed | Marlow Craig | $31,950 |
Source: Public Records
Tax History Compared to Growth
Tax History
| Year | Tax Paid | Tax Assessment Tax Assessment Total Assessment is a certain percentage of the fair market value that is determined by local assessors to be the total taxable value of land and additions on the property. | Land | Improvement |
|---|---|---|---|---|
| 2024 | $2,272 | $98,600 | $7,800 | $90,800 |
| 2023 | $2,220 | $94,520 | $7,800 | $86,720 |
| 2022 | $1,933 | $82,560 | $7,800 | $74,760 |
| 2021 | $1,610 | $67,440 | $7,800 | $59,640 |
| 2020 | $1,462 | $61,440 | $7,800 | $53,640 |
| 2019 | $1,468 | $61,440 | $7,800 | $53,640 |
| 2018 | $1,517 | $61,440 | $7,800 | $53,640 |
| 2017 | $0 | $54,960 | $7,800 | $47,160 |
| 2016 | $1,112 | $49,000 | $7,800 | $41,200 |
| 2015 | -- | $47,080 | $7,800 | $39,280 |
| 2014 | -- | $47,080 | $7,800 | $39,280 |
| 2013 | -- | $47,080 | $7,800 | $39,280 |
Source: Public Records
Map
Nearby Homes
- 4389 Georgia 225
- 557 McCamy Rd
- 308 Twin Lakes Rd
- 351 Valley Rd
- 273 Ellis Cir
- 257 Ellis Cir
- 757 Ellis Cir
- 89 Arrowhead Dr
- 1594 Goswick Rd
- 1800 Georgia 286
- 214 Nassau Cir
- 5710 Hwy 255n
- 567 Fullers Chapel Rd
- 355 Heritage Cir
- 685 Goswick Rd
- 42 Evergreen Rd Unit LOT N
- 255 Norton Bridge Rd
- 359 Norton Bridge Rd
- 38 Earls Way
- 216 Earls Way
- 427 Chandlers Ridge
- 465 Chandlers Ridge
- 427 Chandler's Ridge Dr
- 401 Chandlers Ridge
- 440 Chandlers Ridge
- 448 Chandlers Ridge
- 426 Chandlers Ridge
- 448 Chandler's Ridge Dr
- 381 Chandlers Ridge
- 420 Chandlers Ridge
- 392 Chandlers Ridge
- 402 Chandler's Ridge Dr
- 365 Chandlers Ridge
- 370 Chandlers Ridge
- 370 Chandler's Ridge Dr
- 345 Chandler's Ridge Dr
- 345 Chandlers Ridge
- 352 Chandler's Ridge Dr
- 352 Chandlers Ridge
- 309 Chandlers Ridge