Estimated Value: $456,000 - $592,000
3
Beds
3
Baths
2,622
Sq Ft
$195/Sq Ft
Est. Value
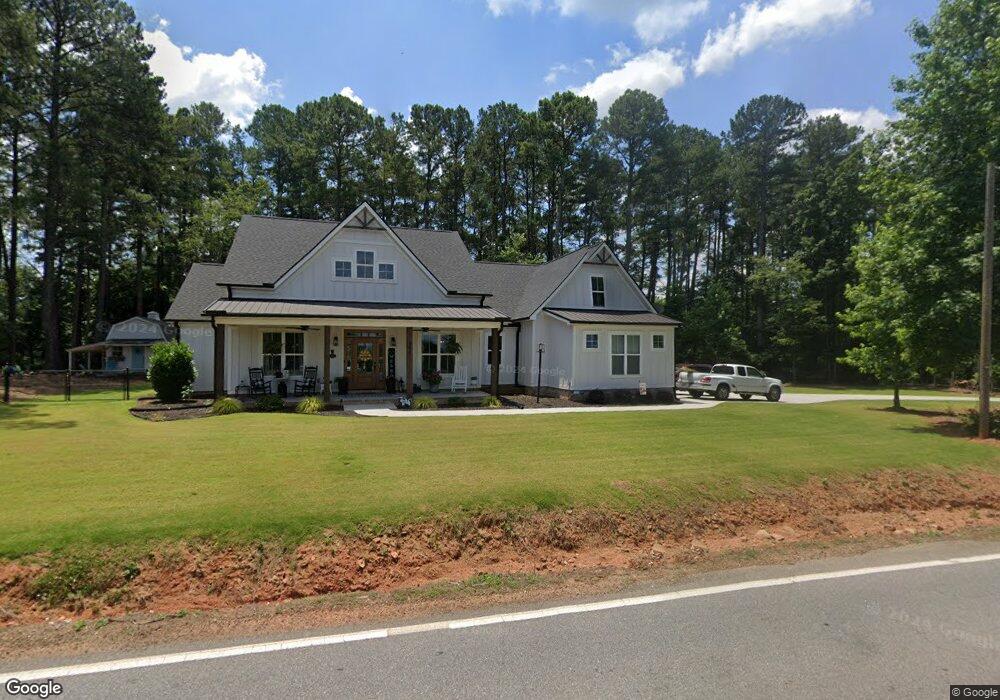
About This Home
This home is located at 451 Gowan Rd, Inman, SC 29349 and is currently estimated at $510,687, approximately $194 per square foot. 451 Gowan Rd is a home with nearby schools including Campobello-Gramling School, Chapman High School, and Inman Christian Academy.
Ownership History
Date
Name
Owned For
Owner Type
Purchase Details
Closed on
Jan 15, 2020
Sold by
Brink Howard M and Brink Nancy P
Bought by
Hammett Billy J and Hammett Amy D
Current Estimated Value
Purchase Details
Closed on
Oct 16, 2015
Sold by
Skinner Chris O and Skinner Janet H
Bought by
Brink Howard M and Brink Nancy P
Purchase Details
Closed on
Oct 17, 2006
Sold by
Smith Michael G and Smith Anna T
Bought by
Skinner Chris O and Skinner Janet H
Purchase Details
Closed on
Jan 19, 2005
Sold by
Fisher Roger D
Bought by
Skinner Chris O and Skinner Janet H
Purchase Details
Closed on
Oct 28, 2004
Sold by
Smith Michael G and Smith Anna T
Bought by
Fisher Roger D
Purchase Details
Closed on
Jul 8, 2003
Sold by
Cothran Linda G and Barnette Paulette G
Bought by
Smith Michael G and Smith Anna T
Purchase Details
Closed on
Jul 16, 2002
Sold by
Gowan Margaret N
Bought by
Cothran Linda G and Barnette Paulette G
Create a Home Valuation Report for This Property
The Home Valuation Report is an in-depth analysis detailing your home's value as well as a comparison with similar homes in the area
Home Values in the Area
Average Home Value in this Area
Purchase History
| Date | Buyer | Sale Price | Title Company |
|---|---|---|---|
| Hammett Billy J | $42,000 | None Available | |
| Brink Howard M | $14,173 | -- | |
| Skinner Chris O | $35,000 | Capital Title Agency | |
| Skinner Chris O | $29,500 | -- | |
| Reynolds Stan G | $29,500 | -- | |
| Upper Valley Falls Properties Inc | $29,500 | -- | |
| Fisher Roger D | $500 | -- | |
| Smith Michael G | $23,000 | -- | |
| Cothran Linda G | -- | -- |
Source: Public Records
Tax History
| Year | Tax Paid | Tax Assessment Tax Assessment Total Assessment is a certain percentage of the fair market value that is determined by local assessors to be the total taxable value of land and additions on the property. | Land | Improvement |
|---|---|---|---|---|
| 2025 | $2,209 | $14,393 | $838 | $13,555 |
| 2024 | $2,209 | $14,393 | $838 | $13,555 |
| 2023 | $2,209 | $14,393 | $838 | $13,555 |
Source: Public Records
Map
Nearby Homes
- 441 Gramling School Rd
- 459 Gramling School Rd
- 200 Sneeds Dr
- 191 Skinner Rd
- 360 Geddis Rd
- 130 Settle Dr
- 160 Eubanks Farm Rd
- 318 Bellrock Rd
- 317 Bellrock Rd
- 329 Bellrock Rd
- 325 Bellrock Rd
- 314 Bellrock Rd
- 321 Bellrock Rd
- 310 Bellrock Rd
- 322 Bellrock Rd
- 304 Bellrock Rd
- 815 Shadow Creek Dr
- 2454 Runion Rd
- 151 Suddeth Rd
- 1411 Ballenger Rd
- 704 Tinsberry Ln
- 207 Pinefield Cir
- 481 Gowan Rd
- 712 Tinsberry Ln
- 480 Gowan Rd
- 213 Pinefield Cir
- 450 Gowan Rd
- 705 Tinsberry Ln
- 908 Lansfair Dr
- 210 Pinefield Cir
- 709 Tinsberry Ln
- 718 Tinsberry Ln
- 912 Lansfair Dr
- 219 Pinefield Cir
- 495 Gowan Rd
- 713 Tinsberry Ln
- 918 Lansfair Dr
- 717 Tinsberry Ln
- 310 Pinefield Cir
- 915 Lansfair Dr
Your Personal Tour Guide
Ask me questions while you tour the home.