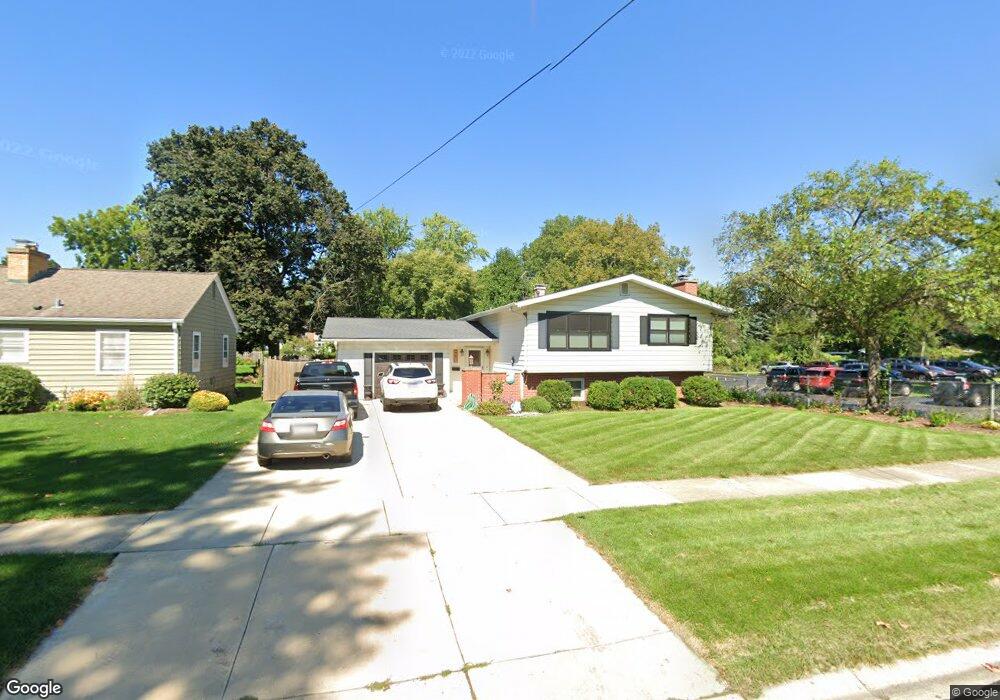
451 Laurel St Batavia, IL 60510
Southeast Batavia NeighborhoodEstimated Value: $370,959 - $395,000
4
Beds
--
Bath
1,267
Sq Ft
$304/Sq Ft
Est. Value
About This Home
This home is located at 451 Laurel St, Batavia, IL 60510 and is currently estimated at $385,740, approximately $304 per square foot. 451 Laurel St is a home located in Kane County with nearby schools including J B Nelson Elementary School, Sam Rotolo Middle School, and Batavia Sr High School.
Ownership History
Date
Name
Owned For
Owner Type
Purchase Details
Closed on
Sep 16, 2019
Sold by
Smith Adam R and Smith Sylvia
Bought by
Smith Adam R and Smith Sylvia
Current Estimated Value
Purchase Details
Closed on
May 22, 2017
Sold by
Smith Robert Ray and Smith Wendy Lee
Bought by
Smith Adam R
Home Financials for this Owner
Home Financials are based on the most recent Mortgage that was taken out on this home.
Original Mortgage
$194,400
Outstanding Balance
$161,756
Interest Rate
4.12%
Mortgage Type
New Conventional
Estimated Equity
$223,984
Purchase Details
Closed on
Apr 30, 1996
Sold by
Roper Sharlene K
Bought by
Smith Robert Ray and Smith Wendy Lee
Home Financials for this Owner
Home Financials are based on the most recent Mortgage that was taken out on this home.
Original Mortgage
$60,000
Interest Rate
7.86%
Create a Home Valuation Report for This Property
The Home Valuation Report is an in-depth analysis detailing your home's value as well as a comparison with similar homes in the area
Home Values in the Area
Average Home Value in this Area
Purchase History
| Date | Buyer | Sale Price | Title Company |
|---|---|---|---|
| Smith Adam R | -- | Accommodation | |
| Smith Adam R | $243,000 | Chicago Title Ins Co | |
| Smith Robert Ray | $150,000 | Advanced Title Services Inc |
Source: Public Records
Mortgage History
| Date | Status | Borrower | Loan Amount |
|---|---|---|---|
| Open | Smith Adam R | $194,400 | |
| Previous Owner | Smith Robert Ray | $60,000 |
Source: Public Records
Tax History
| Year | Tax Paid | Tax Assessment Tax Assessment Total Assessment is a certain percentage of the fair market value that is determined by local assessors to be the total taxable value of land and additions on the property. | Land | Improvement |
|---|---|---|---|---|
| 2024 | $8,004 | $109,230 | $31,138 | $78,092 |
| 2023 | $7,820 | $99,138 | $28,261 | $70,877 |
| 2022 | $7,566 | $92,652 | $26,412 | $66,240 |
| 2021 | $7,258 | $87,871 | $25,049 | $62,822 |
| 2020 | $7,076 | $86,181 | $24,567 | $61,614 |
| 2019 | $6,956 | $83,130 | $23,697 | $59,433 |
| 2018 | $6,673 | $79,963 | $22,794 | $57,169 |
| 2017 | $5,564 | $66,988 | $22,042 | $44,946 |
| 2016 | $5,440 | $65,037 | $21,400 | $43,637 |
| 2015 | -- | $63,556 | $20,913 | $42,643 |
| 2014 | -- | $61,556 | $20,255 | $41,301 |
| 2013 | -- | $72,466 | $24,825 | $47,641 |
Source: Public Records
Map
Nearby Homes
- 414 Cleveland Ave
- 304 S Prairie St
- 637 E Wilson St
- Lot 1 Center St
- 694 Hart Rd
- 121 S Raddant Rd
- Lot 4 Manchester Ave
- 1025 E Wilson St
- 417 N Van Buren St
- 820 N Van Buren St
- 860 S River St
- 524 N College St
- 404 S Batavia Ave
- 330 First St
- 637 Madison St
- 345 Main St
- 1136 Pine Ct
- 323 Illinois Ave
- 724 S Jefferson St
- 1676 Carlstedt Dr
- 445 Laurel St
- 439 Laurel St
- 450 Cleveland Ave
- 444 Cleveland Ave
- 431 Laurel St
- 438 Cleveland Ave
- 444 Laurel St
- 434 Cleveland Ave
- 450 Laurel St
- 440 Laurel St
- 458 Cleveland Ave
- 423 Laurel St
- 434 Laurel St
- 424 Cleveland Ave
- 417 Laurel St
- 506 Cleveland Ave
- 428 Laurel St
- 418 Cleveland Ave
- 420 Laurel St
- 455 Chestnut St
Your Personal Tour Guide
Ask me questions while you tour the home.