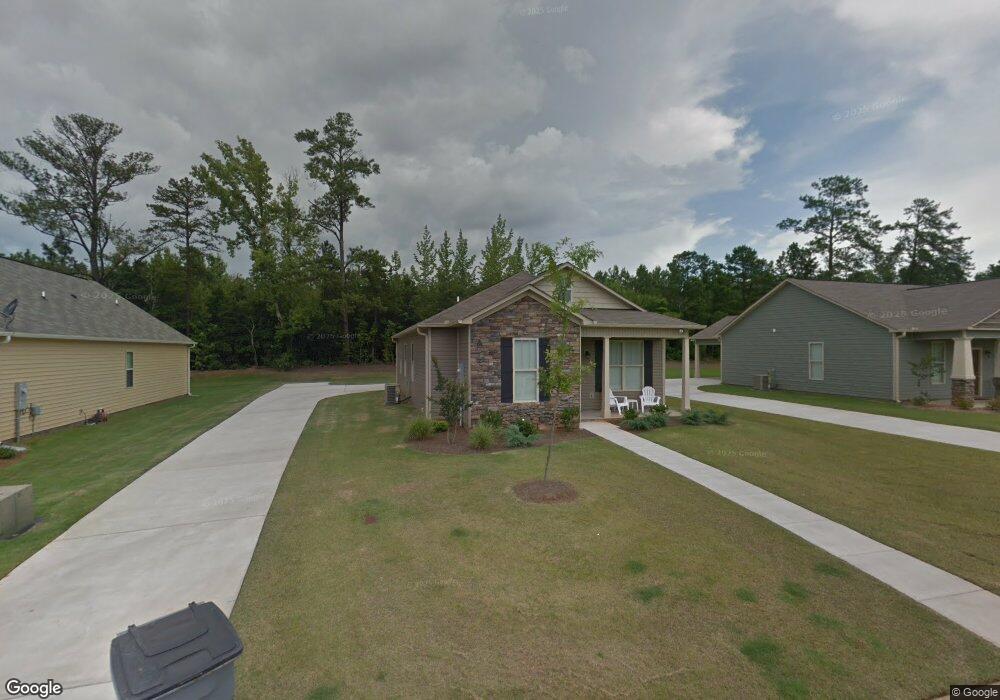
451 N Page St Unit LOT 14 Lagrange, GA 30241
Estimated Value: $199,997 - $223,000
3
Beds
2
Baths
1,407
Sq Ft
$152/Sq Ft
Est. Value
About This Home
This home is located at 451 N Page St Unit LOT 14, Lagrange, GA 30241 and is currently estimated at $213,249, approximately $151 per square foot. 451 N Page St Unit LOT 14 is a home located in Troup County with nearby schools including Franklin Forest Elementary School, Hollis Hand Elementary School, and Hillcrest Elementary School.
Ownership History
Date
Name
Owned For
Owner Type
Purchase Details
Closed on
Aug 21, 2020
Sold by
Harmon Keely E
Bought by
Turner Catherine J
Current Estimated Value
Home Financials for this Owner
Home Financials are based on the most recent Mortgage that was taken out on this home.
Original Mortgage
$133,241
Outstanding Balance
$118,194
Interest Rate
3%
Mortgage Type
FHA
Estimated Equity
$95,055
Purchase Details
Closed on
Mar 17, 2017
Sold by
Chinn Andrew Casey
Bought by
Harmon Keely E
Purchase Details
Closed on
Jan 23, 2013
Sold by
Dri Stoney Creek Llc
Bought by
Chinn Andrew Casey
Home Financials for this Owner
Home Financials are based on the most recent Mortgage that was taken out on this home.
Original Mortgage
$113,795
Interest Rate
3.38%
Mortgage Type
New Conventional
Create a Home Valuation Report for This Property
The Home Valuation Report is an in-depth analysis detailing your home's value as well as a comparison with similar homes in the area
Home Values in the Area
Average Home Value in this Area
Purchase History
| Date | Buyer | Sale Price | Title Company |
|---|---|---|---|
| Turner Catherine J | $135,700 | -- | |
| Harmon Keely E | $114,500 | -- | |
| Chinn Andrew Casey | $111,400 | -- |
Source: Public Records
Mortgage History
| Date | Status | Borrower | Loan Amount |
|---|---|---|---|
| Open | Turner Catherine J | $133,241 | |
| Previous Owner | Chinn Andrew Casey | $113,795 |
Source: Public Records
Tax History Compared to Growth
Tax History
| Year | Tax Paid | Tax Assessment Tax Assessment Total Assessment is a certain percentage of the fair market value that is determined by local assessors to be the total taxable value of land and additions on the property. | Land | Improvement |
|---|---|---|---|---|
| 2024 | $1,827 | $68,960 | $10,000 | $58,960 |
| 2023 | $1,813 | $68,480 | $10,000 | $58,480 |
| 2022 | $1,614 | $59,800 | $8,000 | $51,800 |
| 2021 | $1,462 | $50,480 | $8,000 | $42,480 |
| 2020 | $1,522 | $50,480 | $8,000 | $42,480 |
| 2019 | $1,489 | $49,360 | $8,000 | $41,360 |
| 2018 | $1,381 | $49,360 | $8,000 | $41,360 |
| 2017 | $1,429 | $49,360 | $8,000 | $41,360 |
| 2016 | $1,371 | $47,458 | $4,000 | $43,458 |
| 2015 | $1,249 | $43,330 | $4,000 | $39,330 |
| 2014 | $1,189 | $41,260 | $4,000 | $37,260 |
| 2013 | -- | $44,236 | $4,000 | $40,236 |
Source: Public Records
Map
Nearby Homes
- 400 S Page St
- 134 S Page St
- 517 Tradition Place
- 519 Tradition Place
- 129 Celebration Blvd
- 117 Celebration Blvd
- 112 Celebration Blvd
- 200 Crestwood Dr
- 793 Celebration Blvd
- 114 Briarcliff Rd
- 89 Chase Rd
- 114 Crestwood Dr
- 806 New Franklin Rd
- 210 Hearthstone Dr
- 121 Ct
- 204 Colonial St
- 105 Ridgefield Dr
- 105 Lenox Cir
- 101 Lenox Cir
- 305 Lenox Cir
- 451 N Page St
- 441 N Page St Unit LOT 13
- 441 N Page St
- 461 N Page St
- 461 N Page St Unit LOT 15
- 431 N Page St Unit 12
- 431 N Page St
- 471 N Page St Unit 16
- 421 N Page St Unit LOT 11
- 481 N Page St Unit 17
- 450 N Page St
- 460 N Page St
- 460 N Page St Unit 67
- 440 N Page St
- 170 Stoney Creek Dr Unit LOT 67A
- 411 N Page St Unit LOT 10
- 411 N Page St
- 430 N Page St
- 160 Stoney Creek Dr
- 160 Stoney Creek Dr Unit LOT 66A