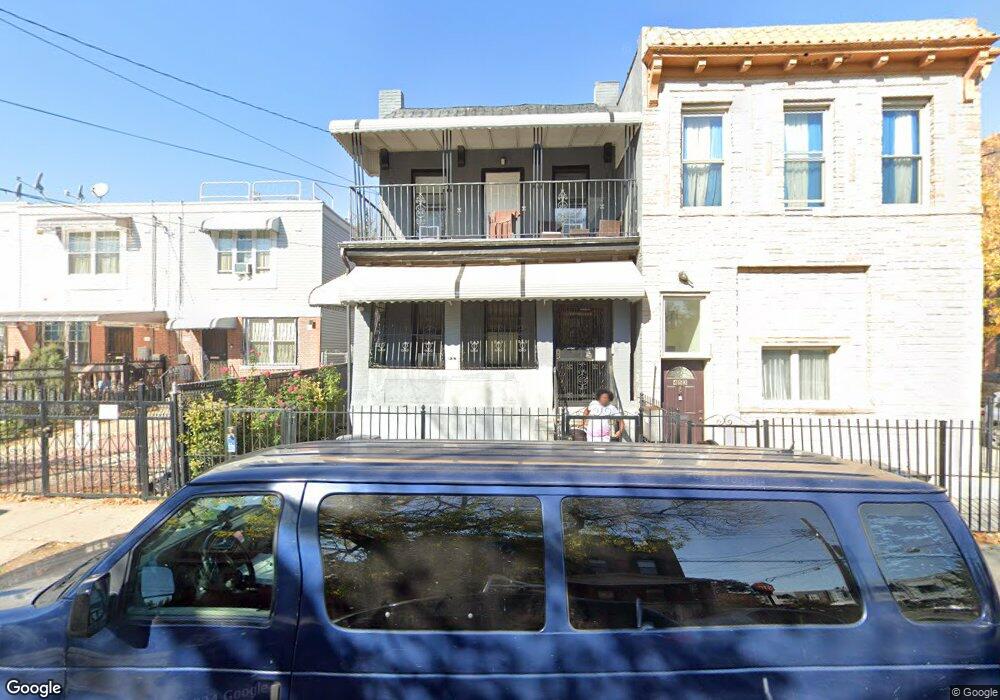
451 Newport St Brooklyn, NY 11207
Brownsville NeighborhoodEstimated Value: $750,971 - $1,324,000
--
Bed
--
Bath
1,672
Sq Ft
$586/Sq Ft
Est. Value
About This Home
This home is located at 451 Newport St, Brooklyn, NY 11207 and is currently estimated at $978,993, approximately $585 per square foot. 451 Newport St is a home located in Kings County with nearby schools including P.S. 190 - Sheffield, Achievement First - East New York School, and Grace Christian Educational.
Ownership History
Date
Name
Owned For
Owner Type
Purchase Details
Closed on
Dec 11, 2024
Sold by
Stone Vivine
Bought by
451 Newport St Property Llc
Current Estimated Value
Purchase Details
Closed on
May 1, 2024
Sold by
Senior Vivine and Stone Vivine
Bought by
Stone Vivine
Purchase Details
Closed on
Dec 7, 2017
Sold by
Lian Partners Llc
Bought by
Senior Vivine
Home Financials for this Owner
Home Financials are based on the most recent Mortgage that was taken out on this home.
Original Mortgage
$736,415
Interest Rate
3.94%
Mortgage Type
Purchase Money Mortgage
Purchase Details
Closed on
Aug 7, 2017
Sold by
Grd Development Llc
Bought by
Lian Partners Llc
Purchase Details
Closed on
May 9, 2017
Sold by
Asher Jeffrey and Asher Oscar Johnson
Bought by
Grd Development Llc
Home Financials for this Owner
Home Financials are based on the most recent Mortgage that was taken out on this home.
Original Mortgage
$375,000
Interest Rate
4.08%
Mortgage Type
New Conventional
Create a Home Valuation Report for This Property
The Home Valuation Report is an in-depth analysis detailing your home's value as well as a comparison with similar homes in the area
Home Values in the Area
Average Home Value in this Area
Purchase History
| Date | Buyer | Sale Price | Title Company |
|---|---|---|---|
| 451 Newport St Property Llc | -- | -- | |
| Stone Vivine | -- | -- | |
| Stone Vivine | -- | -- | |
| Senior Vivine | $750,000 | -- | |
| Senior Vivine | $750,000 | -- | |
| Lian Partners Llc | -- | -- | |
| Lian Partners Llc | -- | -- | |
| Grd Development Llc | $261,250 | -- | |
| Grd Development Llc | $261,250 | -- |
Source: Public Records
Mortgage History
| Date | Status | Borrower | Loan Amount |
|---|---|---|---|
| Previous Owner | Senior Vivine | $736,415 | |
| Previous Owner | Grd Development Llc | $375,000 |
Source: Public Records
Tax History Compared to Growth
Tax History
| Year | Tax Paid | Tax Assessment Tax Assessment Total Assessment is a certain percentage of the fair market value that is determined by local assessors to be the total taxable value of land and additions on the property. | Land | Improvement |
|---|---|---|---|---|
| 2025 | $4,144 | $57,180 | $18,660 | $38,520 |
| 2024 | $4,144 | $61,860 | $18,660 | $43,200 |
| 2023 | $3,953 | $54,960 | $18,660 | $36,300 |
| 2022 | $3,665 | $55,980 | $18,660 | $37,320 |
| 2021 | $3,750 | $43,260 | $18,660 | $24,600 |
| 2020 | $2,813 | $36,180 | $18,660 | $17,520 |
| 2019 | $3,703 | $40,020 | $18,660 | $21,360 |
| 2018 | $3,505 | $17,194 | $8,355 | $8,839 |
| 2017 | $1,674 | $8,210 | $4,263 | $3,947 |
| 2016 | $1,551 | $7,761 | $4,966 | $2,795 |
| 2015 | $934 | $7,761 | $5,038 | $2,723 |
| 2014 | $934 | $7,663 | $5,264 | $2,399 |
Source: Public Records
Map
Nearby Homes
- 541 Hinsdale St
- 533 Snediker Ave
- 576 Williams Ave
- 578 Williams Ave
- 582 Williams Ave
- 442 Newport St
- 584 Hinsdale St
- 589 Hinsdale St
- 606 Alabama Ave
- 610 Alabama Ave
- 650 Williams Ave
- 660 Williams Ave Unit 142
- 563 Powell St
- 546 Powell St
- 699 Sackman St
- 1755 Linden Blvd
- 1753 Linden Blvd
- 406 Hinsdale St
- 679 Georgia Ave
- 661 Sheffield Ave
- 447 Newport St
- 453 Newport St
- 445 Newport St
- 443 Newport St
- 552 Hinsdale St
- 441 Newport St
- 548 Hinsdale St
- 553 Hinsdale St
- 553 Hinsdale St Unit B7
- 553 Hinsdale St
- 435-439 Newport St
- 546 Hinsdale St
- 546 Hinsdale St Unit 1
- 546 Hinsdale St
- 546 Hinsdale St
- 546 Hinsdale St
- 546 Hinsdale St Unit 2
- 546 Hinsdale St Unit HOUSE
- 437 Newport St
- 544 Hinsdale St