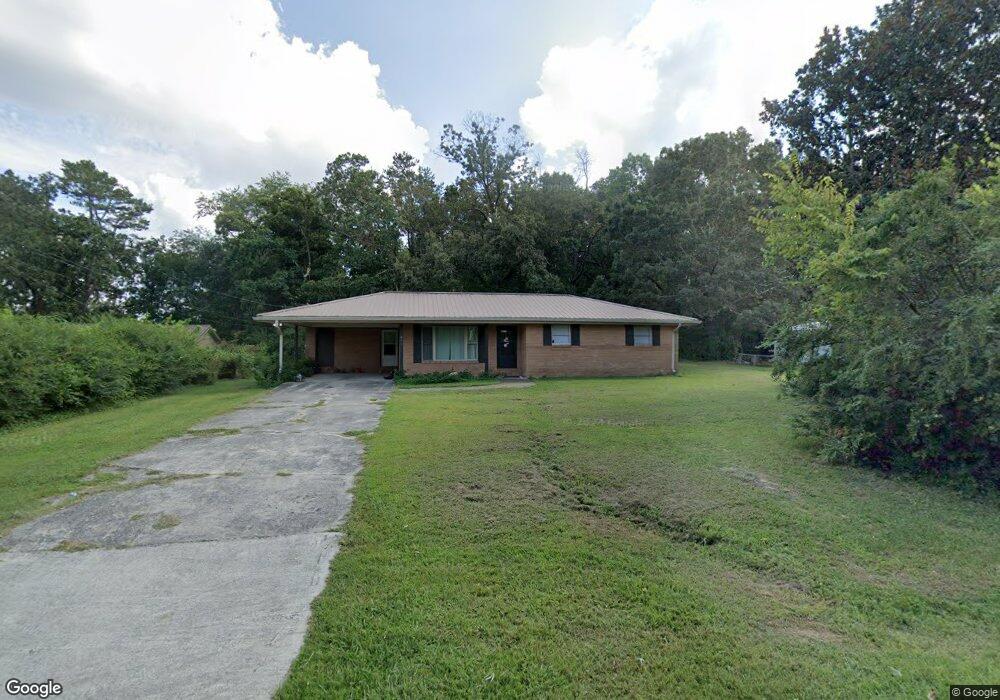
451 Plainview Dr NW Dalton, GA 30721
Estimated Value: $211,000 - $253,000
3
Beds
2
Baths
1,333
Sq Ft
$171/Sq Ft
Est. Value
About This Home
This home is located at 451 Plainview Dr NW, Dalton, GA 30721 and is currently estimated at $227,333, approximately $170 per square foot. 451 Plainview Dr NW is a home located in Whitfield County with nearby schools including New Hope Elementary School, New Hope Middle School, and Northwest Whitfield County High School.
Ownership History
Date
Name
Owned For
Owner Type
Purchase Details
Closed on
Nov 30, 2023
Sold by
Gsh Investments Llc
Bought by
Green Investments Properties
Current Estimated Value
Purchase Details
Closed on
Apr 29, 2019
Sold by
Tidwell Clarence A
Bought by
Gsh Investments Llc
Home Financials for this Owner
Home Financials are based on the most recent Mortgage that was taken out on this home.
Original Mortgage
$1,032,770
Interest Rate
4%
Mortgage Type
New Conventional
Purchase Details
Closed on
Sep 21, 2006
Sold by
Wright Charlotte V
Bought by
Tidwell Clarence A
Home Financials for this Owner
Home Financials are based on the most recent Mortgage that was taken out on this home.
Original Mortgage
$60,382
Interest Rate
6.46%
Mortgage Type
New Conventional
Purchase Details
Closed on
Sep 1, 1990
Bought by
Wright Charlotte
Create a Home Valuation Report for This Property
The Home Valuation Report is an in-depth analysis detailing your home's value as well as a comparison with similar homes in the area
Home Values in the Area
Average Home Value in this Area
Purchase History
| Date | Buyer | Sale Price | Title Company |
|---|---|---|---|
| Green Investments Properties | -- | None Listed On Document | |
| Gsh Investments Llc | -- | -- | |
| Tidwell Clarence A | $80,000 | -- | |
| Wright Charlotte | -- | -- |
Source: Public Records
Mortgage History
| Date | Status | Borrower | Loan Amount |
|---|---|---|---|
| Previous Owner | Gsh Investments Llc | $1,032,770 | |
| Previous Owner | Tidwell Clarence A | $60,382 |
Source: Public Records
Tax History Compared to Growth
Tax History
| Year | Tax Paid | Tax Assessment Tax Assessment Total Assessment is a certain percentage of the fair market value that is determined by local assessors to be the total taxable value of land and additions on the property. | Land | Improvement |
|---|---|---|---|---|
| 2024 | $1,466 | $67,890 | $9,800 | $58,090 |
| 2023 | $1,466 | $48,718 | $6,300 | $42,418 |
| 2022 | $1,120 | $37,985 | $6,300 | $31,685 |
| 2021 | $1,121 | $37,985 | $6,300 | $31,685 |
| 2020 | $1,130 | $37,055 | $6,300 | $30,755 |
| 2019 | $1,149 | $37,055 | $6,300 | $30,755 |
| 2018 | $1,167 | $37,055 | $6,300 | $30,755 |
| 2017 | $1,168 | $37,055 | $6,300 | $30,755 |
| 2016 | $951 | $31,371 | $3,360 | $28,011 |
| 2014 | $844 | $31,371 | $3,360 | $28,011 |
| 2013 | -- | $31,370 | $3,360 | $28,010 |
Source: Public Records
Map
Nearby Homes
- 287 Williams Rd NW
- 303 Cherokee Trail NW
- 1425 Wiggs Dr
- 3025 Cleveland Hwy
- 1015 S Ridge Dr
- 609 Cherokee Trail NW
- 112 Albertson Dr
- 1016 Prince Way
- 192 Carly Dr
- 106 Albertson Dr
- 0 West R W Ridge Dr
- 1626 Lagenia Ct
- 2256 Waring Rd NW
- 2215 Kerr Rd NW
- 2616 Cleveland Hwy
- The Braselton II Plan at The Andros
- The Manchester II Plan at The Andros
- The Buford II Plan at The Andros
- The Ellison II Plan at The Andros
- The Norwood II Plan at The Andros
- 447 Plainview Dr NW
- 501 Plainview Dr NW
- 504 Plainview Dr NW
- 446 Plainview Dr NW
- 508 Plainview Dr NW
- 441 Plainview Dr NW
- 616 Wooded Hills Dr
- 612 Wooded Hills Rd NW
- 444 Plainview Dr NW
- 614 Wooded Hills Rd NW
- 0 Plainview Dr Unit 1164820
- 439 Plainview Dr NW
- 00 Plainview Dr NW
- 408 A Plainview Dr NW Unit 2 A
- 528 Plainview Dr NW
- 616 Wooded Hills Rd NW
- 616 Wooded Hills Rd NW
- 611 Wooded Hills Rd NW
- 611 Wooded Hills Rd NW
- 615 Wooded Hills Rd NW