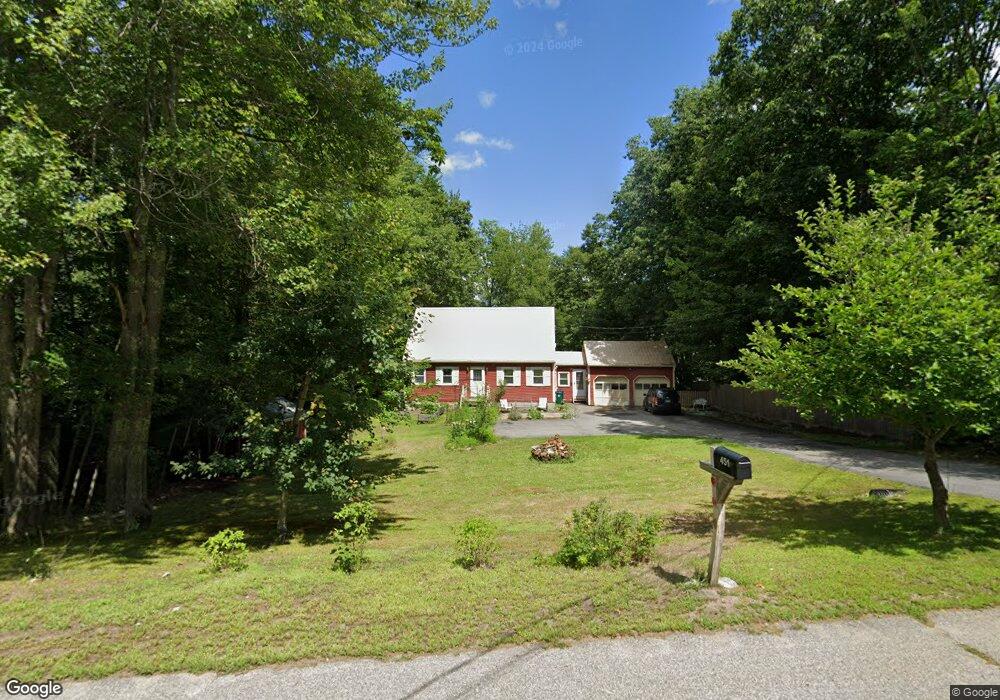
451 Pool St Biddeford, ME 04005
South Biddeford NeighborhoodEstimated Value: $451,283 - $531,000
3
Beds
1
Bath
1,306
Sq Ft
$374/Sq Ft
Est. Value
About This Home
This home is located at 451 Pool St, Biddeford, ME 04005 and is currently estimated at $487,821, approximately $373 per square foot. 451 Pool St is a home located in York County with nearby schools including John F Kennedy Memorial School, Biddeford Primary School, and Biddeford Intermediate School.
Ownership History
Date
Name
Owned For
Owner Type
Purchase Details
Closed on
May 2, 2017
Sold by
Ternus Mary A
Bought by
Schrader William M and Schrader Gloria M
Current Estimated Value
Home Financials for this Owner
Home Financials are based on the most recent Mortgage that was taken out on this home.
Original Mortgage
$167,000
Outstanding Balance
$137,994
Interest Rate
4.3%
Mortgage Type
New Conventional
Estimated Equity
$349,827
Purchase Details
Closed on
Jan 29, 2015
Sold by
Ternus Scott D and Ternus Scott D
Bought by
Ternus Mary A
Purchase Details
Closed on
Jun 23, 2008
Sold by
Poirier Gerald G and Poirier Mary E
Bought by
Ternus Scott Daniel and Ternus Mary Alice
Home Financials for this Owner
Home Financials are based on the most recent Mortgage that was taken out on this home.
Original Mortgage
$165,000
Interest Rate
6.1%
Mortgage Type
Unknown
Create a Home Valuation Report for This Property
The Home Valuation Report is an in-depth analysis detailing your home's value as well as a comparison with similar homes in the area
Home Values in the Area
Average Home Value in this Area
Purchase History
| Date | Buyer | Sale Price | Title Company |
|---|---|---|---|
| Schrader William M | -- | -- | |
| Schrader William M | -- | -- | |
| Ternus Mary A | -- | -- | |
| Ternus Scott Daniel | -- | -- | |
| Schrader William M | -- | -- | |
| Ternus Mary A | -- | -- | |
| Ternus Scott Daniel | -- | -- |
Source: Public Records
Mortgage History
| Date | Status | Borrower | Loan Amount |
|---|---|---|---|
| Open | Schrader William M | $167,000 | |
| Closed | Schrader William M | $167,000 | |
| Previous Owner | Ternus Scott Daniel | $165,000 |
Source: Public Records
Tax History
| Year | Tax Paid | Tax Assessment Tax Assessment Total Assessment is a certain percentage of the fair market value that is determined by local assessors to be the total taxable value of land and additions on the property. | Land | Improvement |
|---|---|---|---|---|
| 2025 | $5,806 | $388,600 | $210,800 | $177,800 |
| 2024 | $5,478 | $385,200 | $210,800 | $174,400 |
| 2023 | $5,004 | $381,400 | $207,000 | $174,400 |
| 2022 | $4,761 | $290,100 | $140,000 | $150,100 |
| 2021 | $4,446 | $243,900 | $118,400 | $125,500 |
| 2020 | $3,872 | $217,600 | $103,100 | $114,500 |
| 2019 | $4,348 | $217,600 | $103,100 | $114,500 |
| 2018 | $3,655 | $217,600 | $103,100 | $114,500 |
| 2017 | $3,830 | $213,500 | $103,100 | $110,400 |
| 2016 | $4,240 | $213,500 | $103,100 | $110,400 |
| 2015 | $4,157 | $213,500 | $103,100 | $110,400 |
| 2014 | $4,054 | $213,500 | $103,100 | $110,400 |
| 2013 | -- | $218,200 | $106,700 | $111,500 |
Source: Public Records
Map
Nearby Homes
- 625 Pool St
- 650 Pool St
- 5 Twin Island Dr
- 26 Meeting House Rd
- 74 Guinea Rd
- 9 Windward Ridge
- 4 Walker Dr Unit 101
- 3 Walker Dr Unit 101
- 3 Walker Dr Unit 101
- 378 Pool St
- 18 Camp Ellis Ave
- TBD 530 Ferry Rd
- 353 Pool St
- 295 Ferry Rd
- 1 Main Ave
- 10 Lower Beach Rd
- 8 Rockwood Dr
- 9 Riverside Ave
- 343 Pool St
- 30 Vines Rd
Your Personal Tour Guide
Ask me questions while you tour the home.