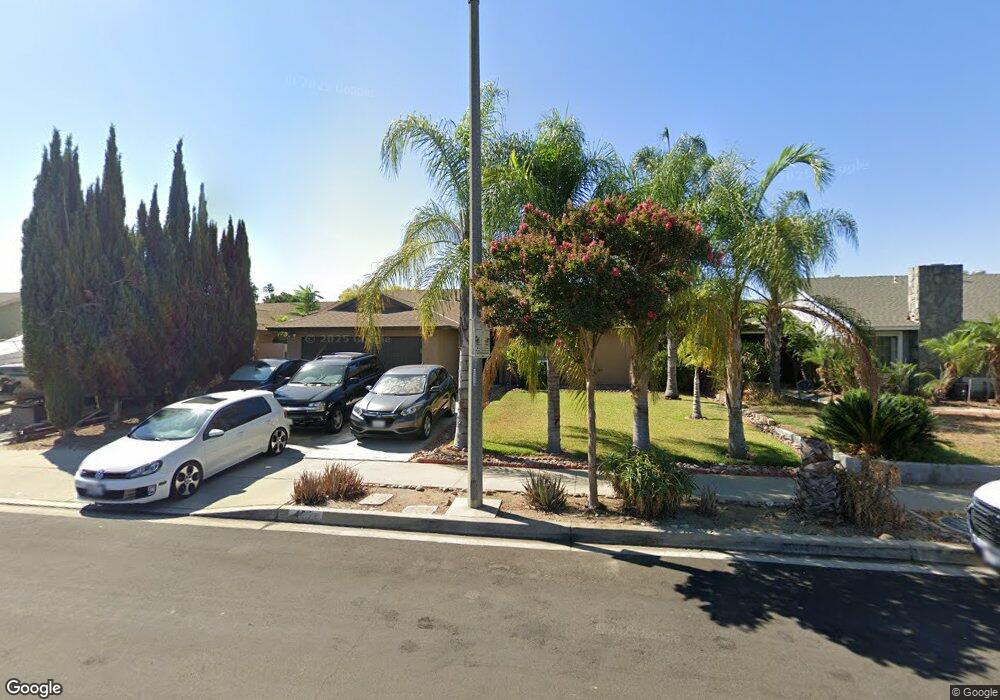
451 Sonoma Ct Ontario, CA 91762
Downtown Ontario NeighborhoodEstimated Value: $681,656 - $739,000
3
Beds
2
Baths
1,387
Sq Ft
$515/Sq Ft
Est. Value
About This Home
This home is located at 451 Sonoma Ct, Ontario, CA 91762 and is currently estimated at $714,664, approximately $515 per square foot. 451 Sonoma Ct is a home located in San Bernardino County with nearby schools including Richard Haynes Elementary, Oaks Middle, and Ontario High School.
Ownership History
Date
Name
Owned For
Owner Type
Purchase Details
Closed on
Jun 12, 2019
Sold by
Nguyen Uyen Jenny
Bought by
Nguyen Uyen Jenny and The Hoang Uyen Living Trust
Current Estimated Value
Purchase Details
Closed on
Dec 22, 2010
Sold by
Us Bank National Association
Bought by
Le Jonathan Hoang and Nguyen Uyen Jenny
Home Financials for this Owner
Home Financials are based on the most recent Mortgage that was taken out on this home.
Original Mortgage
$141,000
Outstanding Balance
$95,958
Interest Rate
4.82%
Mortgage Type
New Conventional
Estimated Equity
$618,706
Purchase Details
Closed on
Jul 5, 2010
Sold by
Gutierrez Roberto and Gutierrez Martha
Bought by
Us Bank National Association
Purchase Details
Closed on
Jul 3, 2002
Sold by
Acdan Jimmy A and Acdan Ruby J
Bought by
Gutierrez Roberto and Gutierrez Martha
Home Financials for this Owner
Home Financials are based on the most recent Mortgage that was taken out on this home.
Original Mortgage
$215,000
Interest Rate
6.6%
Purchase Details
Closed on
Feb 2, 2000
Sold by
Elliott Janis
Bought by
Acdan Jimmy A and Acdan Ruby J
Home Financials for this Owner
Home Financials are based on the most recent Mortgage that was taken out on this home.
Original Mortgage
$144,036
Interest Rate
8.34%
Mortgage Type
FHA
Create a Home Valuation Report for This Property
The Home Valuation Report is an in-depth analysis detailing your home's value as well as a comparison with similar homes in the area
Home Values in the Area
Average Home Value in this Area
Purchase History
| Date | Buyer | Sale Price | Title Company |
|---|---|---|---|
| Nguyen Uyen Jenny | -- | None Available | |
| Le Jonathan Hoang | $235,000 | Lawyers Title | |
| Us Bank National Association | $217,000 | None Available | |
| Gutierrez Roberto | $215,000 | First Southwestern Title Co | |
| Acdan Jimmy A | $145,000 | Fidelity National Title |
Source: Public Records
Mortgage History
| Date | Status | Borrower | Loan Amount |
|---|---|---|---|
| Open | Le Jonathan Hoang | $141,000 | |
| Previous Owner | Gutierrez Roberto | $215,000 | |
| Previous Owner | Acdan Jimmy A | $144,036 |
Source: Public Records
Tax History
| Year | Tax Paid | Tax Assessment Tax Assessment Total Assessment is a certain percentage of the fair market value that is determined by local assessors to be the total taxable value of land and additions on the property. | Land | Improvement |
|---|---|---|---|---|
| 2025 | $3,386 | $301,078 | $105,057 | $196,021 |
| 2024 | $3,310 | $295,174 | $102,997 | $192,177 |
| 2023 | $3,219 | $289,386 | $100,977 | $188,409 |
| 2022 | $3,178 | $283,712 | $98,997 | $184,715 |
| 2021 | $3,158 | $278,149 | $97,056 | $181,093 |
| 2020 | $3,104 | $275,297 | $96,061 | $179,236 |
| 2019 | $3,078 | $269,899 | $94,177 | $175,722 |
| 2018 | $3,037 | $264,606 | $92,330 | $172,276 |
| 2017 | $2,930 | $259,418 | $90,520 | $168,898 |
| 2016 | $2,817 | $254,331 | $88,745 | $165,586 |
| 2015 | $2,799 | $250,511 | $87,412 | $163,099 |
| 2014 | $2,714 | $245,604 | $85,700 | $159,904 |
Source: Public Records
Map
Nearby Homes
- 1330 S Fern Ave
- 214 W Locust St
- 1606 S Laurel Ave
- 1420 S Euclid Ave
- 1223 S Euclid Ave
- 329 W Maitland St
- 923 S Vine Ave
- 502 W Grevillea St
- 1206 S Cypress Ave Unit F
- 221 E Maple St
- 1855 S Fern Ave
- 1216 S Cypress Ave Unit E
- 1112 S Cypress Ave
- 1218 S Cypress Ave Unit B
- 0 W Phillips St
- 1230 S Cypress Ave
- 908 W Linden St
- 1343 S Sultana Ave
- 1214 S Sultana Ave
- 302 E Francis St
Your Personal Tour Guide
Ask me questions while you tour the home.