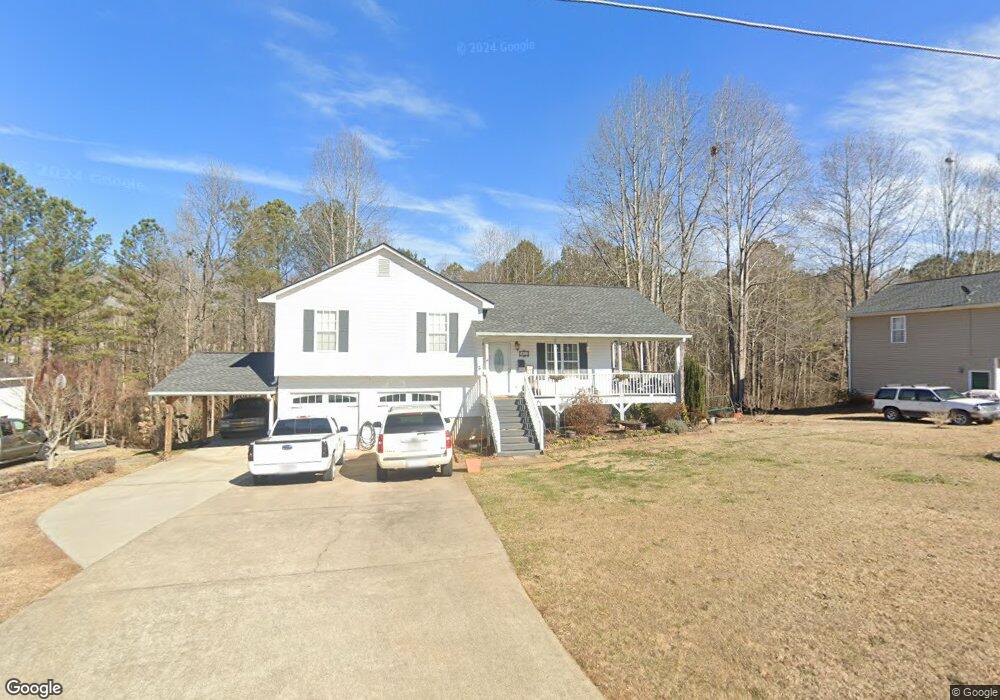
451 Southern Trace Crossing Rockmart, GA 30153
Estimated Value: $238,000 - $261,000
3
Beds
2
Baths
1,140
Sq Ft
$218/Sq Ft
Est. Value
About This Home
This home is located at 451 Southern Trace Crossing, Rockmart, GA 30153 and is currently estimated at $248,346, approximately $217 per square foot. 451 Southern Trace Crossing is a home located in Paulding County with nearby schools including Sara M. Ragsdale Elementary School, Carl Scoggins Sr. Middle School, and Paulding County High School.
Ownership History
Date
Name
Owned For
Owner Type
Purchase Details
Closed on
Jul 15, 2025
Sold by
Morgan Eric G
Bought by
Barnes Seth Liston Spires
Current Estimated Value
Home Financials for this Owner
Home Financials are based on the most recent Mortgage that was taken out on this home.
Original Mortgage
$282,828
Outstanding Balance
$282,345
Interest Rate
6.81%
Mortgage Type
New Conventional
Estimated Equity
-$33,999
Purchase Details
Closed on
Apr 20, 2010
Sold by
Hud & Housing Of Urban Dev
Bought by
Morgan Eric G
Purchase Details
Closed on
Oct 6, 2009
Sold by
Bac Home Loans Servicing Lp
Bought by
Hud-Housing Of Urban Dev
Purchase Details
Closed on
Jan 2, 2002
Sold by
Rakestraw Jason W
Bought by
Smith Joshua J
Home Financials for this Owner
Home Financials are based on the most recent Mortgage that was taken out on this home.
Original Mortgage
$88,655
Interest Rate
6.8%
Mortgage Type
New Conventional
Create a Home Valuation Report for This Property
The Home Valuation Report is an in-depth analysis detailing your home's value as well as a comparison with similar homes in the area
Home Values in the Area
Average Home Value in this Area
Purchase History
| Date | Buyer | Sale Price | Title Company |
|---|---|---|---|
| Barnes Seth Liston Spires | $280,000 | -- | |
| Morgan Eric G | $43,175 | -- | |
| Hud-Housing Of Urban Dev | -- | -- | |
| Bac Home Loans Servicing | $127,675 | -- | |
| Smith Joshua J | $86,900 | -- |
Source: Public Records
Mortgage History
| Date | Status | Borrower | Loan Amount |
|---|---|---|---|
| Open | Barnes Seth Liston Spires | $282,828 | |
| Previous Owner | Smith Joshua J | $88,655 |
Source: Public Records
Tax History Compared to Growth
Tax History
| Year | Tax Paid | Tax Assessment Tax Assessment Total Assessment is a certain percentage of the fair market value that is determined by local assessors to be the total taxable value of land and additions on the property. | Land | Improvement |
|---|---|---|---|---|
| 2024 | $2,387 | $95,948 | $12,000 | $83,948 |
| 2023 | $2,505 | $96,084 | $12,000 | $84,084 |
| 2022 | $2,020 | $77,484 | $12,000 | $65,484 |
| 2021 | $1,796 | $61,808 | $6,000 | $55,808 |
| 2020 | $1,704 | $57,380 | $6,000 | $51,380 |
| 2019 | $1,559 | $51,744 | $6,000 | $45,744 |
| 2018 | $1,330 | $44,148 | $6,000 | $38,148 |
| 2017 | $1,105 | $36,160 | $6,000 | $30,160 |
| 2016 | $922 | $30,508 | $6,000 | $24,508 |
| 2015 | $907 | $29,456 | $6,000 | $23,456 |
| 2014 | $788 | $24,972 | $6,000 | $18,972 |
| 2013 | -- | $15,320 | $6,000 | $9,320 |
Source: Public Records
Map
Nearby Homes
- 572 Southern Trace Dr
- 110 Conifer Ln
- 117 Wallace Way
- 96 Southern Trace Way
- 318 Thorn Thicket Dr
- 412 Southern Trace Dr
- 69 Southern Trace Way
- 256 Prometheous Way
- 716 Presley Farm Pkwy
- 662 Presley Farm Pkwy
- 540 Presley Farm Pkwy
- 642 Presley Farm Pkwy
- 61 Fairfax Dr
- 280 Carthage Blvd
- 79 Southern Trace Dr
- 440 Prometheous Way
- 96 Southern Trace Dr
- 790 Presley Farm Pkwy
- 516 Barnwood Dr
- 461 Barnwood Dr
- 427 Southern Trace Crossing
- 467 Southern Trace Crossing
- 409 Southern Trace Crossing
- 409 Southern Trace Crossing Unit 156
- 489 Southern Trace Crossing
- 452 Southern Trace Crossing
- 452 Southern Trace Crossing
- 509 Southern Trace Crossing
- 15 Thorn Thicket Dr
- 375 Southern Trace Crossing
- 410 Southern Trace Crossing
- 33 Thorn Thicket Dr
- 54 Thorn Thicket Dr
- 54 Thorn Thicket Dr Unit 54
- 533 Southern Trace Crossing Unit 162
- 533 Southern Trace Crossing
- 374 Southern Trace Crossing
- 53 Thorn Thicket Dr
- 516 Southern Trace Crossing
- 557 Southern Trace Crossing