Estimated Value: $634,000 - $733,403
--
Bed
3
Baths
1,693
Sq Ft
$406/Sq Ft
Est. Value
About This Home
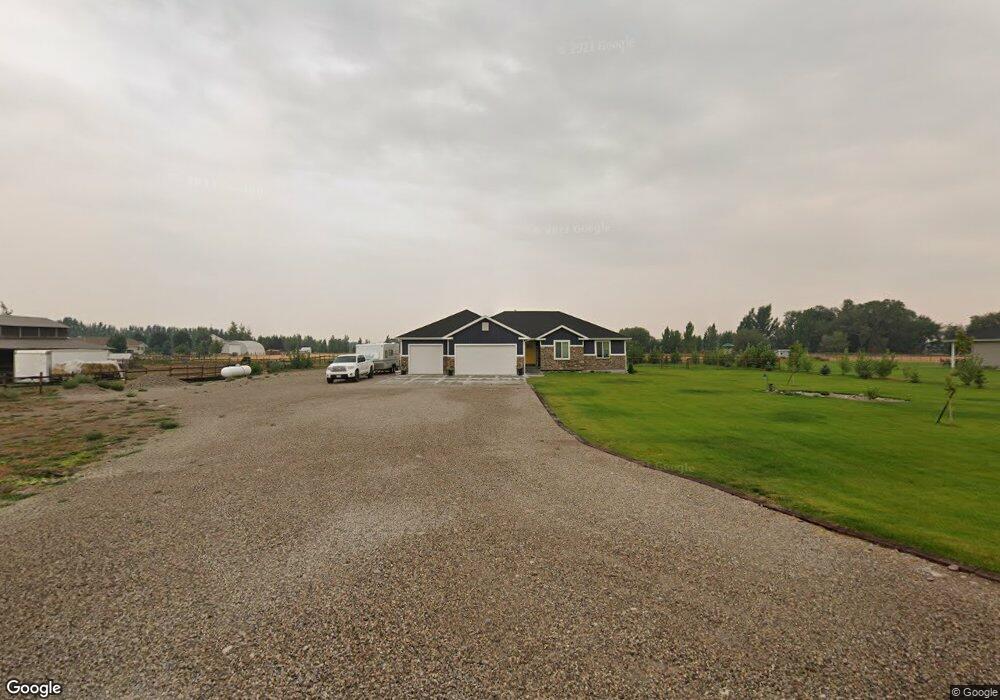
This home is located at 4510 E 266 N, Rigby, ID 83442 and is currently estimated at $687,351, approximately $405 per square foot. 4510 E 266 N is a home with nearby schools including South Fork Elementary School, Rigby Middle School, and Rigby High School.
Ownership History
Date
Name
Owned For
Owner Type
Purchase Details
Closed on
Apr 20, 2018
Sold by
Stoneridge Construction Llc
Bought by
Thompson Morgan and Thompson Amanda
Current Estimated Value
Home Financials for this Owner
Home Financials are based on the most recent Mortgage that was taken out on this home.
Original Mortgage
$333,017
Outstanding Balance
$284,671
Interest Rate
4.46%
Mortgage Type
New Conventional
Estimated Equity
$402,680
Purchase Details
Closed on
Oct 5, 2017
Sold by
Colledge Jeremy
Bought by
Stoneridge Construction Llc
Create a Home Valuation Report for This Property
The Home Valuation Report is an in-depth analysis detailing your home's value as well as a comparison with similar homes in the area
Home Values in the Area
Average Home Value in this Area
Purchase History
| Date | Buyer | Sale Price | Title Company |
|---|---|---|---|
| Thompson Morgan | -- | Alliance Title Rexburg Offic | |
| Stoneridge Construction Llc | -- | Alliance Title - Rigby Offic |
Source: Public Records
Mortgage History
| Date | Status | Borrower | Loan Amount |
|---|---|---|---|
| Open | Thompson Morgan | $333,017 |
Source: Public Records
Tax History
| Year | Tax Paid | Tax Assessment Tax Assessment Total Assessment is a certain percentage of the fair market value that is determined by local assessors to be the total taxable value of land and additions on the property. | Land | Improvement |
|---|---|---|---|---|
| 2025 | $1,558 | $641,259 | $0 | $0 |
| 2024 | $1,558 | $630,107 | $0 | $0 |
| 2023 | $2,258 | $652,170 | $0 | $0 |
| 2022 | $2,833 | $519,306 | $0 | $0 |
| 2021 | $2,671 | $403,404 | $0 | $0 |
| 2020 | $2,155 | $369,861 | $0 | $0 |
| 2019 | $2,306 | $320,614 | $0 | $0 |
| 2018 | $316 | $30,000 | $0 | $0 |
| 2017 | $327 | $30,000 | $0 | $0 |
| 2016 | $331 | $30,000 | $0 | $0 |
| 2015 | $343 | $30,000 | $0 | $0 |
| 2014 | $344 | $30,000 | $0 | $0 |
| 2013 | -- | $30,000 | $0 | $0 |
Source: Public Records
Map
Nearby Homes
Your Personal Tour Guide
Ask me questions while you tour the home.