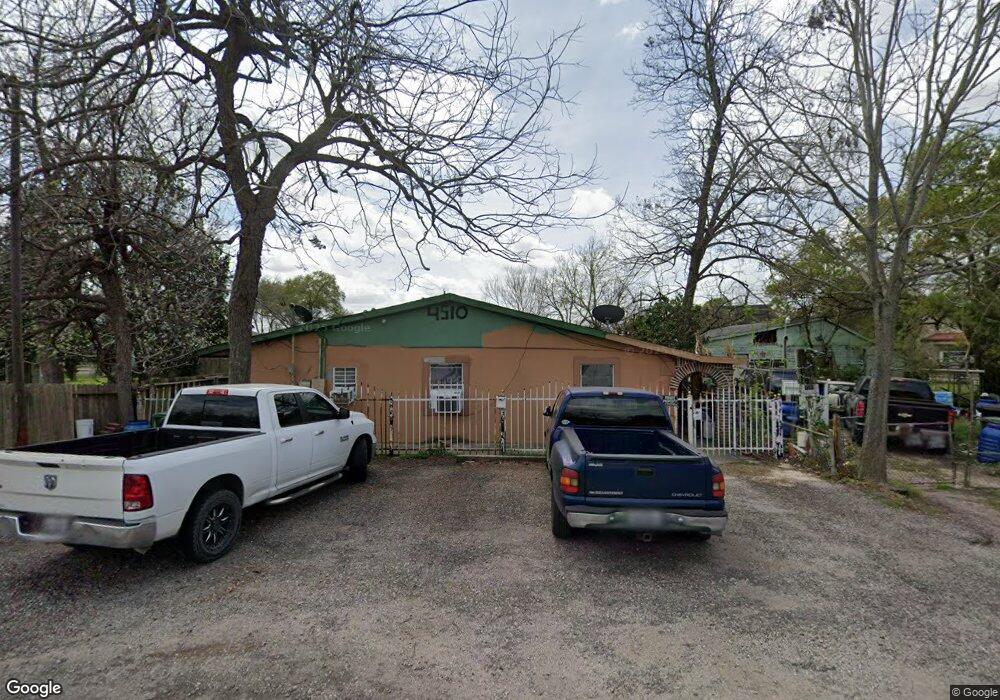
4510 Lelia St Houston, TX 77026
Fifth Ward NeighborhoodEstimated Value: $212,000 - $285,000
4
Beds
3
Baths
2,448
Sq Ft
$97/Sq Ft
Est. Value
About This Home
This home is located at 4510 Lelia St, Houston, TX 77026 and is currently estimated at $238,299, approximately $97 per square foot. 4510 Lelia St is a home located in Harris County with nearby schools including Dogan Elementary School, Fleming Middle School, and Wheatley High School.
Ownership History
Date
Name
Owned For
Owner Type
Purchase Details
Closed on
Jul 7, 2023
Sold by
Soto Maria C and Soto Silvia
Bought by
Soto Arturo and Soto Paula
Current Estimated Value
Purchase Details
Closed on
Apr 10, 2005
Sold by
Gonzalez Julian M and Gonzalez Amparo S
Bought by
Soto Maria C and Soto Silvia
Purchase Details
Closed on
Apr 24, 1998
Sold by
Longoria Ruth
Bought by
Rivas Pablo
Home Financials for this Owner
Home Financials are based on the most recent Mortgage that was taken out on this home.
Original Mortgage
$136,096
Interest Rate
7.09%
Create a Home Valuation Report for This Property
The Home Valuation Report is an in-depth analysis detailing your home's value as well as a comparison with similar homes in the area
Home Values in the Area
Average Home Value in this Area
Purchase History
| Date | Buyer | Sale Price | Title Company |
|---|---|---|---|
| Soto Arturo | -- | None Listed On Document | |
| Soto Maria C | -- | -- | |
| Rivas Pablo | -- | Stewart Title |
Source: Public Records
Mortgage History
| Date | Status | Borrower | Loan Amount |
|---|---|---|---|
| Previous Owner | Rivas Pablo | $136,096 |
Source: Public Records
Tax History Compared to Growth
Tax History
| Year | Tax Paid | Tax Assessment Tax Assessment Total Assessment is a certain percentage of the fair market value that is determined by local assessors to be the total taxable value of land and additions on the property. | Land | Improvement |
|---|---|---|---|---|
| 2025 | $957 | $219,816 | $60,000 | $159,816 |
| 2024 | $957 | $214,938 | $60,000 | $154,938 |
| 2023 | $957 | $219,917 | $51,250 | $168,667 |
| 2022 | $4,080 | $185,281 | $33,750 | $151,531 |
| 2021 | $3,695 | $158,548 | $22,500 | $136,048 |
| 2020 | $3,632 | $149,969 | $22,500 | $127,469 |
| 2019 | $3,526 | $139,362 | $22,500 | $116,862 |
| 2018 | $2,496 | $98,639 | $16,250 | $82,389 |
| 2017 | $2,494 | $98,639 | $16,250 | $82,389 |
| 2016 | $2,351 | $92,985 | $13,750 | $79,235 |
| 2015 | -- | $80,000 | $12,500 | $67,500 |
| 2014 | -- | $115,235 | $12,500 | $102,735 |
Source: Public Records
Map
Nearby Homes