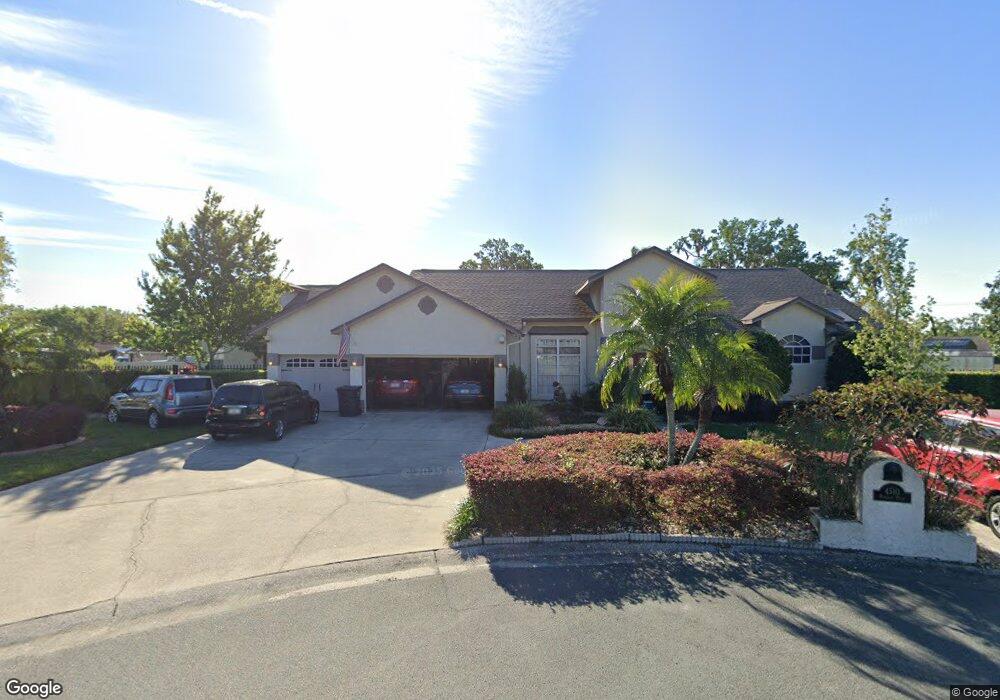
4510 Pawnee Path Valrico, FL 33594
Estimated Value: $525,000 - $639,000
5
Beds
4
Baths
3,700
Sq Ft
$159/Sq Ft
Est. Value
About This Home
This home is located at 4510 Pawnee Path, Valrico, FL 33594 and is currently estimated at $588,430, approximately $159 per square foot. 4510 Pawnee Path is a home located in Hillsborough County with nearby schools including Nelson Elementary School, Mulrennan Middle School, and Durant High School.
Ownership History
Date
Name
Owned For
Owner Type
Purchase Details
Closed on
Feb 19, 2008
Sold by
Aborn Edward and Aborn Tammy Lee
Bought by
Aborn Edward
Current Estimated Value
Purchase Details
Closed on
Aug 3, 1998
Sold by
Treasure Thad C and Treasure A
Bought by
Aborn Edward and Aborn Tammy L
Purchase Details
Closed on
Feb 4, 1997
Sold by
Chumbley Rex A
Bought by
Treasure Thad and Treasure Heather
Home Financials for this Owner
Home Financials are based on the most recent Mortgage that was taken out on this home.
Original Mortgage
$149,150
Interest Rate
7.77%
Mortgage Type
New Conventional
Purchase Details
Closed on
Mar 21, 1995
Sold by
1St Euro Amer Trading
Bought by
Chumbley Rex A
Home Financials for this Owner
Home Financials are based on the most recent Mortgage that was taken out on this home.
Original Mortgage
$115,312
Interest Rate
8.81%
Create a Home Valuation Report for This Property
The Home Valuation Report is an in-depth analysis detailing your home's value as well as a comparison with similar homes in the area
Home Values in the Area
Average Home Value in this Area
Purchase History
| Date | Buyer | Sale Price | Title Company |
|---|---|---|---|
| Aborn Edward | -- | Attorney | |
| Aborn Edward | $183,000 | -- | |
| Treasure Thad | $157,000 | -- | |
| Chumbley Rex A | $125,000 | -- |
Source: Public Records
Mortgage History
| Date | Status | Borrower | Loan Amount |
|---|---|---|---|
| Open | Treasure Thad | $58,000 | |
| Previous Owner | Treasure Thad | $149,150 | |
| Previous Owner | Chumbley Rex A | $115,312 | |
| Closed | Treasure Thad | $0 | |
| Closed | Treasure Thad | $146,400 |
Source: Public Records
Tax History
| Year | Tax Paid | Tax Assessment Tax Assessment Total Assessment is a certain percentage of the fair market value that is determined by local assessors to be the total taxable value of land and additions on the property. | Land | Improvement |
|---|---|---|---|---|
| 2025 | $3,667 | $222,725 | -- | -- |
| 2024 | $3,667 | $216,448 | -- | -- |
| 2023 | $3,527 | $210,144 | $0 | $0 |
| 2022 | $3,337 | $204,023 | $0 | $0 |
| 2021 | $3,285 | $198,081 | $0 | $0 |
| 2020 | $3,195 | $195,346 | $0 | $0 |
| 2019 | $3,090 | $190,954 | $0 | $0 |
| 2018 | $3,036 | $187,394 | $0 | $0 |
| 2017 | $2,991 | $236,559 | $0 | $0 |
| 2016 | $2,953 | $179,765 | $0 | $0 |
| 2015 | $2,985 | $178,515 | $0 | $0 |
| 2014 | $2,959 | $177,098 | $0 | $0 |
| 2013 | -- | $174,481 | $0 | $0 |
Source: Public Records
Map
Nearby Homes
- 4416 Pawnee Path
- 2667 Northwood Park St
- 2601 Villa Dr
- 4541 Mohican Trail
- 1521 Banner Elk St
- 2842 Springdell Cir
- 2763 Valencia Grove Dr
- 2706 Valencia Grove Dr
- 4514 Highfalls Dr
- 4309 Balington Dr
- 2110 Siloam Springs Dr
- 4318 Brandon Ridge Dr
- 3612 Sugar Loaf Ln
- 1710 Tallowtree Cir
- 2726 Buckhorn Preserve Blvd
- 2729 Pankaw Ln
- 2603 Buckhorn Preserve Blvd
- 4103 Yellowwood Dr
- 2706 Durant Trails Blvd
- 1619 Palace Ct
- 4509 Pawnee Path
- 4508 Pawnee Path
- 4608 Duxberry Ln
- 4606 Duxberry Ln
- 4510 Durant Rd
- 4503 Pawnee Path
- 4604 Duxberry Ln
- 4610 Duxberry Ln
- 4602 Duxberry Ln
- 4504 Durant Rd
- 4506 Pawnee Path
- 2208 Cherokee Trail
- 2210 Cherokee Trail
- 2206 Cherokee Trail
- 4504 Pawnee Path
- 4603 Duxberry Ln
- 4612 Duxberry Ln
- 4609 Duxberry Ln
- 2212 Cherokee Trail
- 4509 Mohican Trail
Your Personal Tour Guide
Ask me questions while you tour the home.