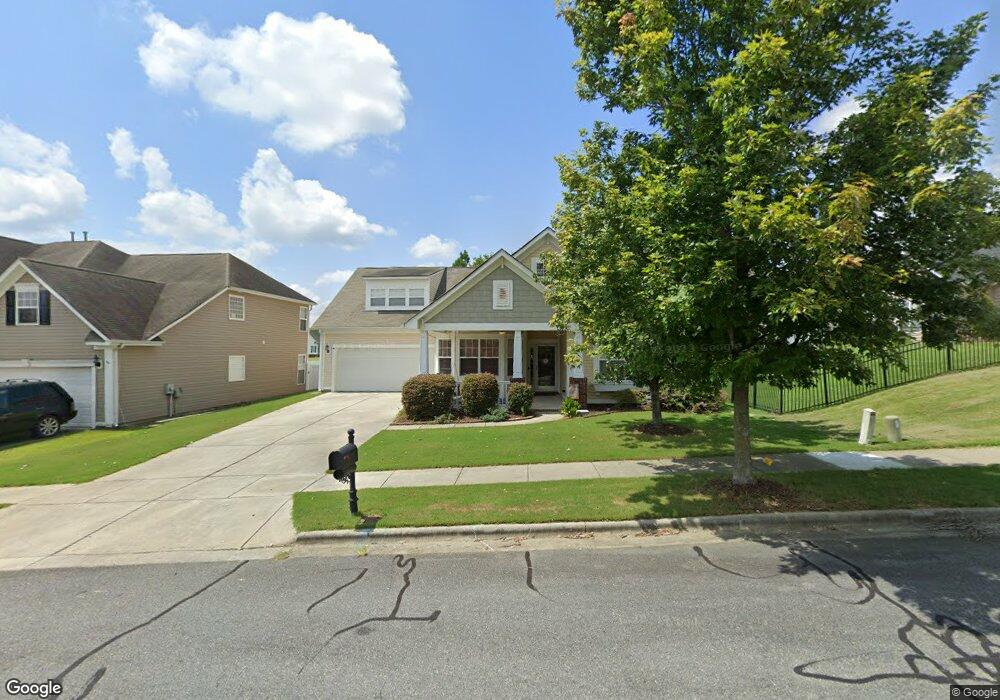
4510 Triumph Dr SW Concord, NC 28027
Estimated Value: $430,295 - $446,000
3
Beds
2
Baths
2,204
Sq Ft
$199/Sq Ft
Est. Value
About This Home
This home is located at 4510 Triumph Dr SW, Concord, NC 28027 and is currently estimated at $437,824, approximately $198 per square foot. 4510 Triumph Dr SW is a home located in Cabarrus County with nearby schools including Pitts School Road Elementary School, Roberta Road Middle School, and Jay M. Robinson High School.
Ownership History
Date
Name
Owned For
Owner Type
Purchase Details
Closed on
Jun 27, 2014
Sold by
Carwile Kevin L and Carwile Anna K
Bought by
Thomas Kyle A and Thomas Lora D
Current Estimated Value
Home Financials for this Owner
Home Financials are based on the most recent Mortgage that was taken out on this home.
Original Mortgage
$194,750
Outstanding Balance
$148,730
Interest Rate
4.23%
Mortgage Type
New Conventional
Estimated Equity
$289,094
Purchase Details
Closed on
Jun 28, 2012
Sold by
Coddle Creek Llc
Bought by
Coddle Creek Llc
Purchase Details
Closed on
May 30, 2006
Sold by
M/I Homes Of Charlotte Llc
Bought by
Carwile Kevin L and Carwile Anna K
Home Financials for this Owner
Home Financials are based on the most recent Mortgage that was taken out on this home.
Original Mortgage
$45,500
Interest Rate
6.12%
Mortgage Type
Stand Alone Second
Create a Home Valuation Report for This Property
The Home Valuation Report is an in-depth analysis detailing your home's value as well as a comparison with similar homes in the area
Home Values in the Area
Average Home Value in this Area
Purchase History
| Date | Buyer | Sale Price | Title Company |
|---|---|---|---|
| Thomas Kyle A | $205,000 | None Available | |
| Coddle Creek Llc | -- | None Available | |
| Carwile Kevin L | $228,000 | Lawyers Title Ins |
Source: Public Records
Mortgage History
| Date | Status | Borrower | Loan Amount |
|---|---|---|---|
| Open | Thomas Kyle A | $194,750 | |
| Previous Owner | Carwile Kevin L | $45,500 | |
| Previous Owner | Carwile Kevin L | $182,300 |
Source: Public Records
Tax History Compared to Growth
Tax History
| Year | Tax Paid | Tax Assessment Tax Assessment Total Assessment is a certain percentage of the fair market value that is determined by local assessors to be the total taxable value of land and additions on the property. | Land | Improvement |
|---|---|---|---|---|
| 2025 | $3,821 | $383,630 | $100,000 | $283,630 |
| 2024 | $3,821 | $383,630 | $100,000 | $283,630 |
| 2023 | $3,021 | $247,590 | $58,000 | $189,590 |
| 2022 | $3,010 | $246,760 | $58,000 | $188,760 |
| 2021 | $3,010 | $246,760 | $58,000 | $188,760 |
| 2020 | $3,010 | $246,760 | $58,000 | $188,760 |
| 2019 | $2,512 | $205,940 | $36,000 | $169,940 |
| 2018 | $2,471 | $205,940 | $36,000 | $169,940 |
| 2017 | $2,430 | $205,940 | $36,000 | $169,940 |
| 2016 | $1,442 | $180,740 | $28,000 | $152,740 |
| 2015 | $2,133 | $180,740 | $28,000 | $152,740 |
| 2014 | $2,133 | $180,740 | $28,000 | $152,740 |
Source: Public Records
Map
Nearby Homes
- 4349 Roberta Rd
- 3254 Hawick Commons Dr
- 4104 Pebblebrook Cir SW
- 3455 Roberta Rd
- 5366 Hardister Place
- 3913 Stough Rd
- 4266 Barley St SW
- 4271 Millet St SW Unit 198
- 706 King Fredrick Ln SW
- 3369 Roberta Rd
- 849 Treva Anne Dr SW
- 842 Treva Anne Dr SW
- 3333 Roberta Rd
- 4114 Carolina Pointe Ct SW
- 5361 Brickyard Terrace Ct
- 4112 Alexis Ct SW
- 3811 Bent Creek Dr SW
- 3807 Bent Creek Dr SW
- 3907 Melissa Dr
- 3133 Roberta Rd
- 4514 Triumph Dr SW
- 3603 Pinetree Ave SW
- 3603 Pinetree Ave SW Unit 63
- 3607 Pinetree Ave SW
- 3611 Pinetree Ave SW
- 3598 Leighton Dr SW
- 4522 Triumph Dr SW
- 3597 Pinetree Ave SW
- 3594 Leighton Dr SW
- 3615 Pinetree Ave SW
- 4526 Triumph Dr SW
- 4496 Triumph Dr SW
- 3597 Leighton Dr SW
- 3593 Pinetree Ave SW
- 4530 Triumph Dr SW
- 3610 Pinetree Ave SW
- 3593 Leighton Dr SW
- 3588 Leighton Dr SW
- 3598 Pinetree Ave SW
- 4492 Triumph Dr SW