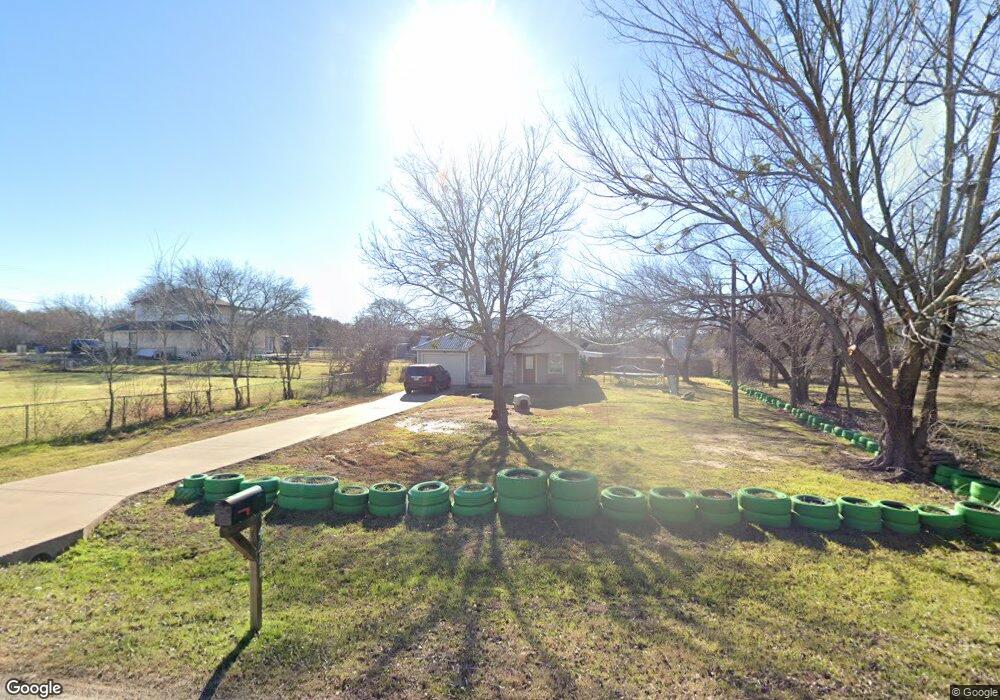
4511 Azalea Dr Granbury, TX 76049
Estimated Value: $228,000 - $288,000
3
Beds
2
Baths
1,192
Sq Ft
$212/Sq Ft
Est. Value
About This Home
This home is located at 4511 Azalea Dr, Granbury, TX 76049 and is currently estimated at $252,634, approximately $211 per square foot. 4511 Azalea Dr is a home located in Hood County with nearby schools including Acton Elementary School, Acton Middle School, and Granbury High School.
Ownership History
Date
Name
Owned For
Owner Type
Purchase Details
Closed on
Oct 24, 2025
Sold by
Mclain Joe Calvin
Bought by
Ramirez Edward
Current Estimated Value
Purchase Details
Closed on
Oct 18, 2007
Sold by
Dooley Charles and Hudson Donna
Bought by
Mclain Joe Calvin
Home Financials for this Owner
Home Financials are based on the most recent Mortgage that was taken out on this home.
Original Mortgage
$93,878
Interest Rate
6.47%
Mortgage Type
Purchase Money Mortgage
Purchase Details
Closed on
Mar 19, 2007
Sold by
Connor Michael O
Bought by
Mclain Joe Calvin
Purchase Details
Closed on
Feb 6, 2007
Sold by
Oconnor Michael
Bought by
Dooley Charles
Purchase Details
Closed on
Jun 2, 1992
Sold by
Garry Properties Inc
Bought by
Mclain Joe Calvin
Purchase Details
Closed on
Apr 8, 1988
Sold by
Garry Properties Mike Walker
Bought by
Mclain Joe Calvin
Create a Home Valuation Report for This Property
The Home Valuation Report is an in-depth analysis detailing your home's value as well as a comparison with similar homes in the area
Home Values in the Area
Average Home Value in this Area
Purchase History
| Date | Buyer | Sale Price | Title Company |
|---|---|---|---|
| Ramirez Edward | -- | None Listed On Document | |
| Mclain Joe Calvin | -- | None Available | |
| Mclain Joe Calvin | -- | -- | |
| Dooley Charles | -- | Central Texas Title | |
| Mclain Joe Calvin | -- | -- | |
| Mclain Joe Calvin | -- | -- |
Source: Public Records
Mortgage History
| Date | Status | Borrower | Loan Amount |
|---|---|---|---|
| Previous Owner | Mclain Joe Calvin | $93,878 |
Source: Public Records
Tax History Compared to Growth
Tax History
| Year | Tax Paid | Tax Assessment Tax Assessment Total Assessment is a certain percentage of the fair market value that is determined by local assessors to be the total taxable value of land and additions on the property. | Land | Improvement |
|---|---|---|---|---|
| 2025 | $1,742 | $231,896 | $24,000 | $215,510 |
| 2024 | $1,579 | $210,815 | $24,000 | $220,760 |
| 2023 | $2,332 | $249,910 | $24,000 | $225,910 |
| 2022 | $1,918 | $254,580 | $12,000 | $242,580 |
| 2021 | $2,432 | $159,260 | $6,000 | $153,260 |
| 2020 | $2,236 | $158,410 | $6,000 | $152,410 |
| 2019 | $2,128 | $168,190 | $6,000 | $162,190 |
| 2018 | $1,935 | $137,590 | $6,000 | $131,590 |
| 2017 | $1,809 | $110,310 | $6,000 | $104,310 |
| 2016 | $1,645 | $98,350 | $6,000 | $92,350 |
| 2015 | $1,723 | $96,370 | $6,000 | $90,370 |
| 2014 | $1,723 | $124,520 | $6,000 | $118,520 |
Source: Public Records
Map
Nearby Homes
- 309 Lilac Dr
- 310 East Rd
- 401 East Rd
- 3517 Bravery Rd
- 2019 Lindale Ln
- 2061 Lindale Ln
- 3008 Lucky Pepper Dr
- 2300 Candlestick Dr
- 3612 Lucky Pepper Dr
- 3609 Lucky Pepper Dr
- 2500 Tom Chaney
- 313 Donna Cir
- 210 Donna Cir
- 1804 Ruffian Rd
- 134 Donna Cir
- 306 Kathy Ln
- 1829 Ruffian Rd
- 117 Donna Cir
- 115 Donna Cir
- 1936 Preakness Dr
- 300 Daisy Dr
- 302 Daisy Dr
- 301 Garry Ct
- 4601 Pecan Ln
- 4510 Azalea Dr
- 4510 Daisy Unit SID[
- 307 Daisy Dr
- 4602 Tommie Faye Dr
- 4504 Azalea Dr
- 4605 Pecan Ln
- 4603 Francis Ct
- 4508 Village Ct
- 4506 Eastview Ct
- 4502 Azalea Dr
- 4602 Francis Ct
- 4605 Francis Ct
- 305 Lilac Dr
- 4512 Carter Ct
- 4604 Francis Ct
- 311 Lilac Dr