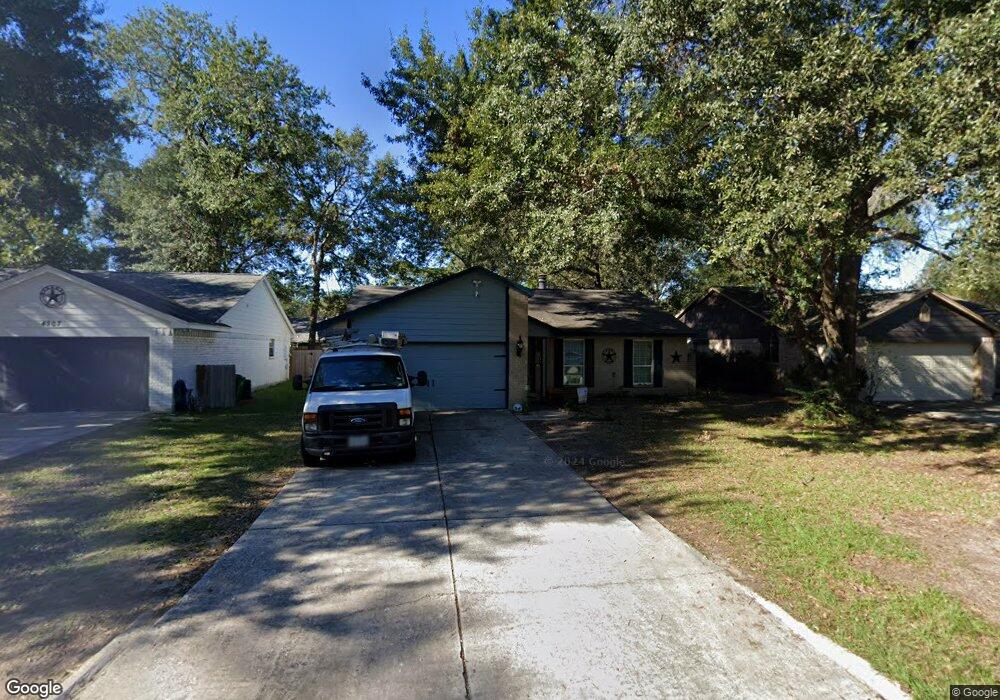
4511 Towergate Dr Spring, TX 77373
Estimated Value: $214,000 - $234,000
3
Beds
2
Baths
1,285
Sq Ft
$173/Sq Ft
Est. Value
About This Home
This home is located at 4511 Towergate Dr, Spring, TX 77373 and is currently estimated at $222,784, approximately $173 per square foot. 4511 Towergate Dr is a home located in Harris County with nearby schools including Mildred Jenkins Elementary School, Dueitt Middle School, and Spring High School.
Ownership History
Date
Name
Owned For
Owner Type
Purchase Details
Closed on
Nov 22, 2000
Sold by
Baireddy Family Trust
Bought by
Lerma Hurtado Guido
Current Estimated Value
Home Financials for this Owner
Home Financials are based on the most recent Mortgage that was taken out on this home.
Original Mortgage
$68,400
Outstanding Balance
$24,802
Interest Rate
7.84%
Estimated Equity
$197,982
Purchase Details
Closed on
Sep 22, 1994
Sold by
Reddy Gopal Baireddy and Reddy Shanti Baireddy
Bought by
Baireddy Family Trust
Purchase Details
Closed on
Jun 30, 1994
Sold by
Widmark Peter O
Bought by
Reddy Gopal B
Home Financials for this Owner
Home Financials are based on the most recent Mortgage that was taken out on this home.
Original Mortgage
$29,350
Interest Rate
8.46%
Mortgage Type
Seller Take Back
Create a Home Valuation Report for This Property
The Home Valuation Report is an in-depth analysis detailing your home's value as well as a comparison with similar homes in the area
Home Values in the Area
Average Home Value in this Area
Purchase History
| Date | Buyer | Sale Price | Title Company |
|---|---|---|---|
| Lerma Hurtado Guido | -- | American Title Co | |
| Baireddy Family Trust | -- | -- | |
| Reddy Gopal B | -- | -- |
Source: Public Records
Mortgage History
| Date | Status | Borrower | Loan Amount |
|---|---|---|---|
| Open | Lerma Hurtado Guido | $68,400 | |
| Previous Owner | Reddy Gopal B | $29,350 |
Source: Public Records
Tax History
| Year | Tax Paid | Tax Assessment Tax Assessment Total Assessment is a certain percentage of the fair market value that is determined by local assessors to be the total taxable value of land and additions on the property. | Land | Improvement |
|---|---|---|---|---|
| 2025 | $4,383 | $230,686 | $37,571 | $193,115 |
| 2024 | $4,383 | $231,883 | $37,571 | $194,312 |
| 2023 | $4,383 | $237,583 | $37,571 | $200,012 |
| 2022 | $5,318 | $216,135 | $37,571 | $178,564 |
| 2021 | $4,346 | $166,740 | $21,236 | $145,504 |
| 2020 | $3,674 | $131,999 | $21,236 | $110,763 |
| 2019 | $3,516 | $121,882 | $21,236 | $100,646 |
| 2018 | $3,554 | $117,685 | $21,236 | $96,449 |
| 2017 | $3,357 | $117,685 | $21,236 | $96,449 |
| 2016 | $2,531 | $88,714 | $14,702 | $74,012 |
| 2015 | $2,031 | $80,150 | $14,702 | $65,448 |
| 2014 | $2,031 | $70,050 | $14,702 | $55,348 |
Source: Public Records
Map
Nearby Homes
- 4519 Tylergate Dr
- 23430 Wintergate Dr
- 4527 Adonis Dr
- 4610 Sloangate Dr
- 4542 Algernon Dr
- 4538 Burkegate Dr
- 4330 Tylergate Dr
- 4425 Algernon Dr
- 4318 Burkegate Dr
- 4307 Sloangate Dr
- 4311 Enchantedgate Dr
- 4303 Chestergate Dr
- 4423 Mossygate Dr
- 4515 Mossygate Dr
- 4606 Fitzwater Dr
- 23122 Cimber Ln
- 23127 Harpergate Dr
- 23115 Ludgate Dr
- 4127 Adonis Dr
- 23114 Harpergate Dr
- 4507 Towergate Dr
- 4515 Towergate Dr
- 4506 Sloangate Dr
- 4510 Sloangate Dr
- 4503 Towergate Dr
- 4510 Towergate Dr
- 4506 Towergate Dr
- 4514 Towergate Dr
- 4502 Sloangate Dr
- 4518 Sloangate Dr
- 23506 Newgate Dr
- 4518 Towergate Dr
- 4502 Towergate Dr
- 23510 Newgate Dr
- 23514 Newgate Dr
- 4527 Towergate Dr
- 4522 Towergate Dr
- 4522 Sloangate Dr
- 23422 Newgate Dr
- 23518 Newgate Dr
Your Personal Tour Guide
Ask me questions while you tour the home.