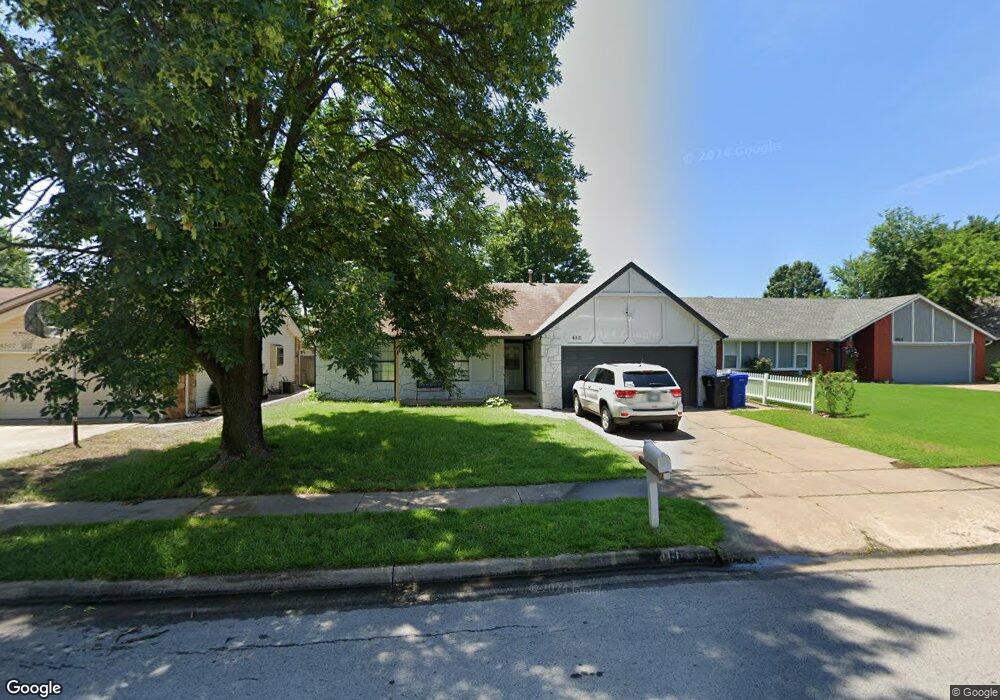
4511 W Lansing Place Broken Arrow, OK 74012
Southbrook NeighborhoodEstimated Value: $205,417 - $223,000
--
Bed
2
Baths
1,453
Sq Ft
$148/Sq Ft
Est. Value
About This Home
This home is located at 4511 W Lansing Place, Broken Arrow, OK 74012 and is currently estimated at $215,104, approximately $148 per square foot. 4511 W Lansing Place is a home located in Tulsa County with nearby schools including Marshall T. Moore Elementary School, Union 8th Grade Center, and Union 6th-7th Grade Center.
Ownership History
Date
Name
Owned For
Owner Type
Purchase Details
Closed on
Oct 3, 2003
Sold by
Truong Tuyen and Pham Phuong
Bought by
Alabi Olubukola T and Alabi Omowunmi T
Current Estimated Value
Home Financials for this Owner
Home Financials are based on the most recent Mortgage that was taken out on this home.
Original Mortgage
$96,485
Outstanding Balance
$45,149
Interest Rate
6.25%
Mortgage Type
FHA
Estimated Equity
$169,955
Purchase Details
Closed on
Jul 29, 1997
Sold by
Meraou Benalla and Meraou Bonnie L
Bought by
Truong Tuyen Cam and Pham Phuong Hm
Purchase Details
Closed on
Mar 1, 1988
Create a Home Valuation Report for This Property
The Home Valuation Report is an in-depth analysis detailing your home's value as well as a comparison with similar homes in the area
Home Values in the Area
Average Home Value in this Area
Purchase History
| Date | Buyer | Sale Price | Title Company |
|---|---|---|---|
| Alabi Olubukola T | $98,500 | Firstitle & Abstract Svcs In | |
| Truong Tuyen Cam | $80,000 | Tulsa Abstract & Title Co | |
| -- | $60,000 | -- |
Source: Public Records
Mortgage History
| Date | Status | Borrower | Loan Amount |
|---|---|---|---|
| Open | Alabi Olubukola T | $96,485 | |
| Closed | Alabi Olubukola T | $2,000 |
Source: Public Records
Tax History Compared to Growth
Tax History
| Year | Tax Paid | Tax Assessment Tax Assessment Total Assessment is a certain percentage of the fair market value that is determined by local assessors to be the total taxable value of land and additions on the property. | Land | Improvement |
|---|---|---|---|---|
| 2024 | $1,641 | $13,130 | $2,378 | $10,752 |
| 2023 | $1,641 | $13,718 | $2,431 | $11,287 |
| 2022 | $1,603 | $12,319 | $2,926 | $9,393 |
| 2021 | $1,558 | $11,931 | $2,834 | $9,097 |
| 2020 | $1,518 | $11,553 | $2,907 | $8,646 |
| 2019 | $1,468 | $11,188 | $2,815 | $8,373 |
| 2018 | $1,417 | $10,833 | $2,726 | $8,107 |
| 2017 | $1,390 | $11,488 | $2,891 | $8,597 |
| 2016 | $1,328 | $11,154 | $3,377 | $7,777 |
| 2015 | $1,329 | $11,154 | $3,377 | $7,777 |
| 2014 | $1,321 | $11,154 | $3,377 | $7,777 |
Source: Public Records
Map
Nearby Homes
- 1109 N Cypress Ave
- 4419 W Madison St
- 910 N Butternut Ct
- 905 N Butternut Ave
- 2416 W Lansing Place
- 4429 W Norman St
- 708 N Aster Ave
- 4501 W Hartford St
- 1312 N Willow Ave
- 4400 W Freeport Cir
- 1429 N Yellowood Ave
- 4408 W Elgin St
- 4441 W Queens St
- 6727 S 112th East Ave
- 4201 W Detroit St
- 11033 E 66th St
- 10903 E 67th St
- 10942 E 76th St
- 1316 N Nyssa Ave
- 10623 E 74th St
- 4515 W Lansing Place
- 4507 W Lansing Place
- 4512 W Lansing St
- 4508 W Lansing St
- 4503 W Lansing Place
- 4516 W Lansing St
- 4519 W Lansing Place
- 4504 W Lansing St
- 4502 W Lansing Place
- 4520 W Lansing St
- 4510 W Lansing Place
- 4523 W Lansing Place
- 4500 W Lansing St
- 4524 W Lansing St
- 4514 W Lansing Place
- 4518 W Lansing Place
- 4501 W Madison St
- 1121 N Butternut Ave
- 4521 W Lansing St
- 1117 N Butternut Ave
