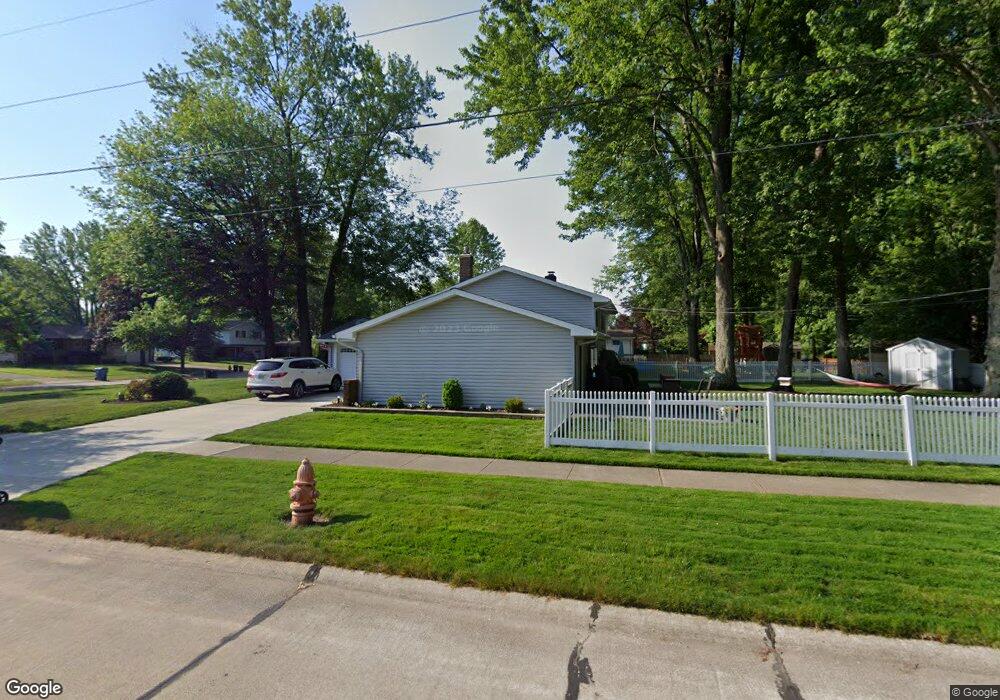
4512 Azalea Ln North Olmsted, OH 44070
Estimated Value: $298,987 - $331,000
3
Beds
2
Baths
2,033
Sq Ft
$157/Sq Ft
Est. Value
About This Home
This home is located at 4512 Azalea Ln, North Olmsted, OH 44070 and is currently estimated at $319,747, approximately $157 per square foot. 4512 Azalea Ln is a home located in Cuyahoga County with nearby schools including Pine Intermediate School, Chestnut Intermediate Elementary School, and North Olmsted Middle School.
Ownership History
Date
Name
Owned For
Owner Type
Purchase Details
Closed on
Jan 17, 2002
Sold by
Tepper Allen J
Bought by
Tepper Allen J and Tepper Irene J
Current Estimated Value
Purchase Details
Closed on
Sep 3, 1999
Sold by
Scott Osborne J and Osborne Maria S
Bought by
Tepper Allen
Home Financials for this Owner
Home Financials are based on the most recent Mortgage that was taken out on this home.
Original Mortgage
$126,900
Interest Rate
5.37%
Purchase Details
Closed on
Jul 25, 1991
Sold by
Krebsbach Paul J
Bought by
Osborne J Scott
Purchase Details
Closed on
Nov 18, 1987
Sold by
Bailey Richard D
Bought by
Krebsbach Paul J
Purchase Details
Closed on
Jul 13, 1983
Sold by
Chandler Alan C and C B
Bought by
Bailey Richard D
Purchase Details
Closed on
Jan 1, 1975
Bought by
Chandler Alan C and C B
Create a Home Valuation Report for This Property
The Home Valuation Report is an in-depth analysis detailing your home's value as well as a comparison with similar homes in the area
Home Values in the Area
Average Home Value in this Area
Purchase History
| Date | Buyer | Sale Price | Title Company |
|---|---|---|---|
| Tepper Allen J | -- | -- | |
| Tepper Allen | $145,000 | -- | |
| Osborne J Scott | $109,000 | -- | |
| Krebsbach Paul J | $92,000 | -- | |
| Bailey Richard D | $73,000 | -- | |
| Chandler Alan C | -- | -- |
Source: Public Records
Mortgage History
| Date | Status | Borrower | Loan Amount |
|---|---|---|---|
| Previous Owner | Tepper Allen | $126,900 |
Source: Public Records
Tax History Compared to Growth
Tax History
| Year | Tax Paid | Tax Assessment Tax Assessment Total Assessment is a certain percentage of the fair market value that is determined by local assessors to be the total taxable value of land and additions on the property. | Land | Improvement |
|---|---|---|---|---|
| 2024 | $5,776 | $84,280 | $17,640 | $66,640 |
| 2023 | $5,631 | $68,950 | $14,840 | $54,110 |
| 2022 | $5,602 | $68,950 | $14,840 | $54,110 |
| 2021 | $5,069 | $68,950 | $14,840 | $54,110 |
| 2020 | $4,890 | $58,910 | $12,670 | $46,240 |
| 2019 | $4,759 | $168,300 | $36,200 | $132,100 |
| 2018 | $4,669 | $58,910 | $12,670 | $46,240 |
| 2017 | $4,589 | $51,560 | $10,120 | $41,440 |
| 2016 | $4,549 | $51,560 | $10,120 | $41,440 |
| 2015 | $4,397 | $51,560 | $10,120 | $41,440 |
| 2014 | $4,397 | $49,560 | $9,730 | $39,830 |
Source: Public Records
Map
Nearby Homes
- 4345 Martin Dr
- 4553 Porter Rd
- #3 Fifth Ave
- #4 Fifth Ave
- #5 Fifth Ave
- #2 Fifth Ave
- 27504 Cottonwood Trail
- 4958 Hampton Dr
- 5032 Devon Dr
- LUCAS TH Plan at Brentwood - Brentwood Townhomes
- LIBBY TH Plan at Brentwood - Brentwood Townhomes
- ABBY TH Plan at Brentwood - Brentwood Townhomes
- 5248 W Park Dr
- 4324 Palomar Ln
- 29852 Lenox Dr
- 29053 W Brockway Dr
- 30105 Center Ridge Rd Unit A
- 5399 Berkshire Dr
- 27693 Butternut Ridge
- 30233 Center Ridge Rd Unit 5
- 4524 Azalea Ln
- 4490 Azalea Ln
- 4536 Azalea Ln
- 4478 Azalea Ln
- 4548 Azalea Ln
- 4515 Azalea Ln
- 4503 Azalea Ln
- 4527 Azalea Ln
- 4491 Azalea Ln
- 4539 Azalea Ln
- 4466 Azalea Ln
- 4560 Azalea Ln
- 4551 Azalea Ln
- 4497 Martin Dr
- 4454 Azalea Ln
- 4467 Azalea Ln
- 4572 Azalea Ln
- 4563 Azalea Ln
- 4516 Camellia Ln
- 4539 Martin Dr