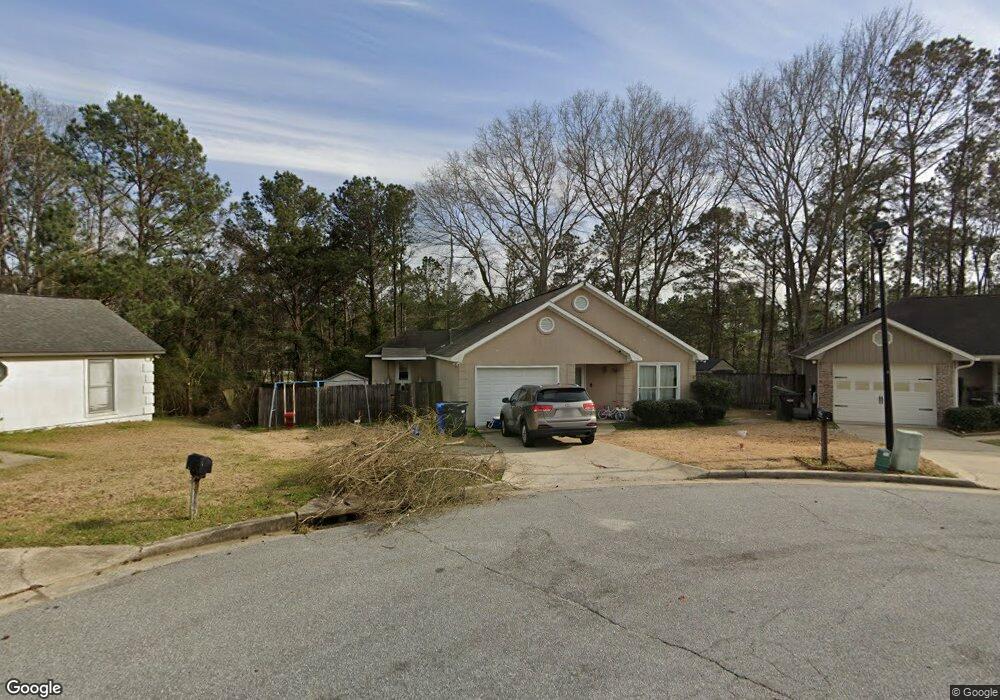
4512 Mayo Dr Columbus, GA 31909
Northern Columbus NeighborhoodEstimated Value: $187,451 - $207,000
2
Beds
3
Baths
1,248
Sq Ft
$158/Sq Ft
Est. Value
About This Home
This home is located at 4512 Mayo Dr, Columbus, GA 31909 and is currently estimated at $197,613, approximately $158 per square foot. 4512 Mayo Dr is a home located in Muscogee County with nearby schools including Eagle Ridge Academy, Blackmon Road Middle School, and Shaw High School.
Ownership History
Date
Name
Owned For
Owner Type
Purchase Details
Closed on
Aug 23, 2022
Sold by
Ragans Robinson Lisa
Bought by
Robinson Bryan and Robinson Lisa Ragans
Current Estimated Value
Purchase Details
Closed on
Sep 24, 2021
Sold by
Hurst James
Bought by
Hurst Lisa Regan
Purchase Details
Closed on
Feb 22, 2008
Sold by
Luckett Kristie
Bought by
Hurst James and Hurst Lisa Regan
Home Financials for this Owner
Home Financials are based on the most recent Mortgage that was taken out on this home.
Original Mortgage
$135,859
Interest Rate
5.63%
Mortgage Type
VA
Purchase Details
Closed on
Mar 20, 2006
Sold by
Luckett Kristie
Bought by
New South Federal Savings Bank
Create a Home Valuation Report for This Property
The Home Valuation Report is an in-depth analysis detailing your home's value as well as a comparison with similar homes in the area
Home Values in the Area
Average Home Value in this Area
Purchase History
| Date | Buyer | Sale Price | Title Company |
|---|---|---|---|
| Robinson Bryan | -- | None Listed On Document | |
| Hurst Lisa Regan | -- | -- | |
| Hurst James | $133,000 | None Available | |
| New South Federal Savings Bank | -- | None Available |
Source: Public Records
Mortgage History
| Date | Status | Borrower | Loan Amount |
|---|---|---|---|
| Previous Owner | Hurst James | $135,859 |
Source: Public Records
Tax History Compared to Growth
Tax History
| Year | Tax Paid | Tax Assessment Tax Assessment Total Assessment is a certain percentage of the fair market value that is determined by local assessors to be the total taxable value of land and additions on the property. | Land | Improvement |
|---|---|---|---|---|
| 2025 | $1,631 | $63,300 | $11,828 | $51,472 |
| 2024 | $1,629 | $63,300 | $11,828 | $51,472 |
| 2023 | $946 | $63,300 | $11,828 | $51,472 |
| 2022 | $1,699 | $52,388 | $11,828 | $40,560 |
| 2021 | $1,692 | $47,620 | $11,828 | $35,792 |
| 2020 | $1,693 | $47,620 | $11,828 | $35,792 |
| 2019 | $1,700 | $47,620 | $11,828 | $35,792 |
| 2018 | $1,700 | $47,620 | $11,828 | $35,792 |
| 2017 | $1,707 | $47,620 | $11,828 | $35,792 |
| 2016 | $1,715 | $54,839 | $6,600 | $48,239 |
| 2015 | $1,655 | $53,330 | $6,600 | $46,730 |
| 2014 | $1,658 | $53,330 | $6,600 | $46,730 |
| 2013 | -- | $53,330 | $6,600 | $46,730 |
Source: Public Records
Map
Nearby Homes
- 7807 Kolven Cove
- 7847 Kolven Cove
- 4701 Turnberry Ln Unit 6
- 4691 Talamore Ln
- 4854 Champions Way
- 7933 Prestwick Ct
- 6630 Lemans Ln
- 6736 Charter Oaks Cir
- 4848 Spring Ridge Dr
- 4840 Spring Ridge Dr
- 4715 Teak Dr
- 7168 Pinewood Ct
- 209 Plum Ct
- 4880 Turnberry Ln
- 8039 Adelaide Dr
- 4417 Sibley St
- 5011 Montego Dr
- 4756 Timarron Loop
- 5041 Montego Dr
- 6500 Charter Oaks Cir