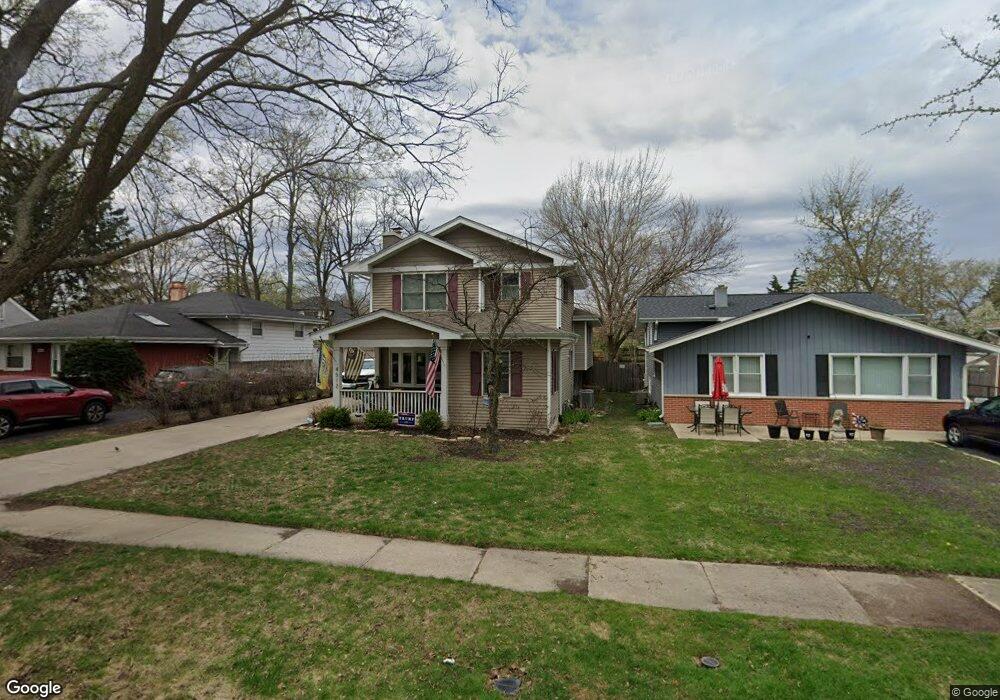
4512 Pershing Ave Downers Grove, IL 60515
Estimated Value: $619,230 - $814,000
4
Beds
3
Baths
2,300
Sq Ft
$300/Sq Ft
Est. Value
About This Home
This home is located at 4512 Pershing Ave, Downers Grove, IL 60515 and is currently estimated at $689,308, approximately $299 per square foot. 4512 Pershing Ave is a home located in DuPage County with nearby schools including Henry Puffer School, Herrick Middle School, and Downer Grove North High School.
Ownership History
Date
Name
Owned For
Owner Type
Purchase Details
Closed on
Oct 31, 2017
Sold by
Gafner Kenneth S and Gafner Allison J
Bought by
Ploch Thomas M and Ploch Kathryn
Current Estimated Value
Home Financials for this Owner
Home Financials are based on the most recent Mortgage that was taken out on this home.
Original Mortgage
$357,000
Interest Rate
3.95%
Mortgage Type
New Conventional
Purchase Details
Closed on
Oct 10, 2008
Sold by
St Pierre Alan D and St Pierre Tomia A
Bought by
Gafner Kenneth S and Gafner Allison J
Home Financials for this Owner
Home Financials are based on the most recent Mortgage that was taken out on this home.
Original Mortgage
$212,000
Interest Rate
6.41%
Mortgage Type
Purchase Money Mortgage
Purchase Details
Closed on
Jul 12, 1999
Sold by
Holz Werner and Holz Mary Ellen
Bought by
Stpierre Alan D and Stpierre Tomia A
Home Financials for this Owner
Home Financials are based on the most recent Mortgage that was taken out on this home.
Original Mortgage
$196,350
Interest Rate
7.43%
Mortgage Type
VA
Create a Home Valuation Report for This Property
The Home Valuation Report is an in-depth analysis detailing your home's value as well as a comparison with similar homes in the area
Home Values in the Area
Average Home Value in this Area
Purchase History
| Date | Buyer | Sale Price | Title Company |
|---|---|---|---|
| Ploch Thomas M | $510,000 | Grater Illinois Title | |
| Gafner Kenneth S | $265,000 | First American Title Ins Co | |
| Stpierre Alan D | $192,500 | -- |
Source: Public Records
Mortgage History
| Date | Status | Borrower | Loan Amount |
|---|---|---|---|
| Previous Owner | Ploch Thomas M | $357,000 | |
| Previous Owner | Gafner Kenneth S | $212,000 | |
| Previous Owner | Stpierre Alan D | $196,350 |
Source: Public Records
Tax History Compared to Growth
Tax History
| Year | Tax Paid | Tax Assessment Tax Assessment Total Assessment is a certain percentage of the fair market value that is determined by local assessors to be the total taxable value of land and additions on the property. | Land | Improvement |
|---|---|---|---|---|
| 2024 | $9,185 | $168,607 | $55,136 | $113,471 |
| 2023 | $8,689 | $153,880 | $50,320 | $103,560 |
| 2022 | $8,703 | $153,880 | $50,320 | $103,560 |
| 2021 | $6,537 | $148,060 | $48,420 | $99,640 |
| 2020 | $6,406 | $145,400 | $47,550 | $97,850 |
| 2019 | $6,125 | $139,110 | $45,490 | $93,620 |
| 2018 | $5,811 | $132,110 | $43,200 | $88,910 |
| 2017 | $4,672 | $86,620 | $41,740 | $44,880 |
| 2016 | $4,621 | $83,490 | $40,230 | $43,260 |
| 2015 | $4,567 | $78,620 | $37,880 | $40,740 |
| 2014 | $4,522 | $75,790 | $36,520 | $39,270 |
| 2013 | $4,464 | $75,970 | $36,610 | $39,360 |
Source: Public Records
Map
Nearby Homes
- 4512 Wilson Ave
- 4424 Arbor Cir Unit 3
- 4601 Wilson Ave
- 2209 Arbor Cir Unit 5
- 4508 Stonewall Ave
- 4408 Stonewall Ave
- 4522 Lee Ave
- 4436 Lee Ave
- 1436 Gilbert Lot 1 Ave
- 4022 Earlston Rd
- 4848 Francisco Ave
- 4947 Stonewall Ave
- 4940 Cornell Ave
- 4939 Lee Ave
- 1805 Gilbert Ave
- 4416 Seeley Ave
- 4014 Morton Ave
- 403 Provence Ct
- 4832 Seeley Ave
- 4140 Seeley Ave
- 4516 Pershing Ave
- 4508 Pershing Ave
- 4520 Pershing Ave
- 4502 Pershing Ave
- 4524 Pershing Ave
- 4500 Pershing Ave
- 4513 Pershing Ave
- 4517 Pershing Ave
- 4505 Pershing Ave
- 4528 Pershing Ave
- 4517 Belmont Rd
- 4509 Pershing Ave
- 4521 Pershing Ave
- 4505 Belmont Rd
- 4532 Pershing Ave
- 4529 Pershing Ave
- 4503 Belmont Rd
- 4507 Belmont Rd
- 4521 Belmont Rd
- 2055 Grant St