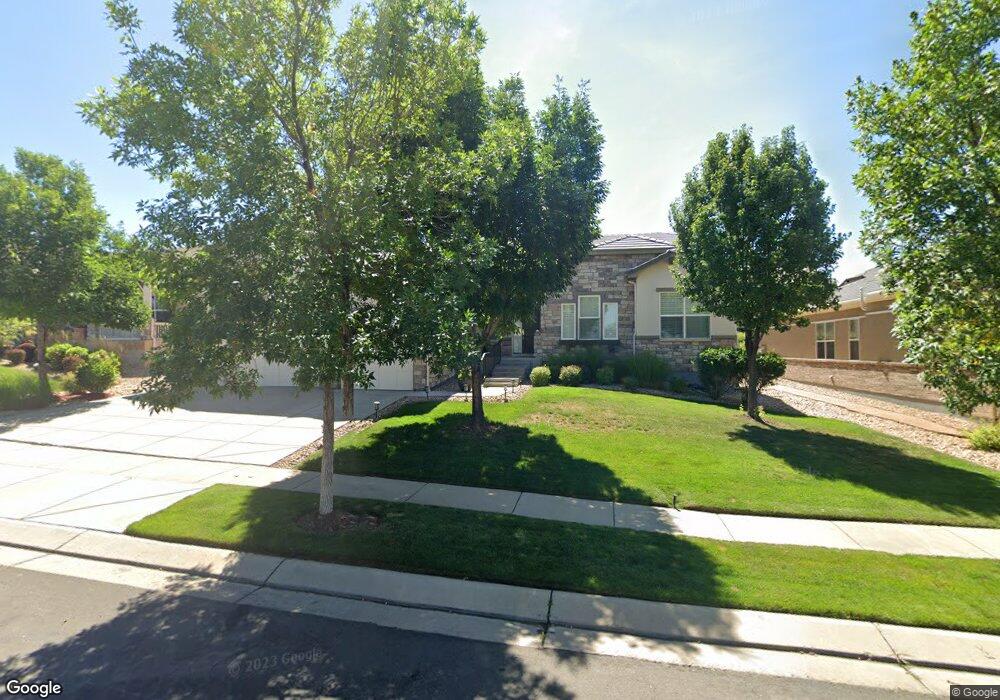
4512 Silver Mountain Loop Broomfield, CO 80023
Anthem NeighborhoodEstimated Value: $1,030,791 - $1,191,000
2
Beds
3
Baths
2,837
Sq Ft
$387/Sq Ft
Est. Value
About This Home
This home is located at 4512 Silver Mountain Loop, Broomfield, CO 80023 and is currently estimated at $1,098,698, approximately $387 per square foot. 4512 Silver Mountain Loop is a home located in Broomfield County with nearby schools including Thunder Vista P-8, Legacy High School, and Prospect Ridge Academy.
Ownership History
Date
Name
Owned For
Owner Type
Purchase Details
Closed on
Jun 3, 2021
Sold by
Ackard Arlynn J and Ackard Stephen L
Bought by
The Stephen And Ackard Family Trust
Current Estimated Value
Home Financials for this Owner
Home Financials are based on the most recent Mortgage that was taken out on this home.
Original Mortgage
$552,596
Outstanding Balance
$500,307
Interest Rate
2.9%
Mortgage Type
New Conventional
Estimated Equity
$598,391
Purchase Details
Closed on
Dec 21, 2010
Sold by
Pulte Home Corporation
Bought by
Ackard Arlynn J and Ackard Stephen L
Home Financials for this Owner
Home Financials are based on the most recent Mortgage that was taken out on this home.
Original Mortgage
$248,000
Interest Rate
2.99%
Mortgage Type
New Conventional
Create a Home Valuation Report for This Property
The Home Valuation Report is an in-depth analysis detailing your home's value as well as a comparison with similar homes in the area
Home Values in the Area
Average Home Value in this Area
Purchase History
| Date | Buyer | Sale Price | Title Company |
|---|---|---|---|
| The Stephen And Ackard Family Trust | -- | None Available | |
| Ackard Arlynn J | $496,000 | None Available |
Source: Public Records
Mortgage History
| Date | Status | Borrower | Loan Amount |
|---|---|---|---|
| Open | The Stephen And Ackard Family Trust | $552,596 | |
| Closed | Ackard Arlynn J | $248,000 |
Source: Public Records
Tax History
| Year | Tax Paid | Tax Assessment Tax Assessment Total Assessment is a certain percentage of the fair market value that is determined by local assessors to be the total taxable value of land and additions on the property. | Land | Improvement |
|---|---|---|---|---|
| 2025 | $8,201 | $72,360 | $13,940 | $58,420 |
| 2024 | $8,201 | $71,820 | $13,260 | $58,560 |
| 2023 | $8,137 | $78,320 | $14,460 | $63,860 |
| 2022 | $6,843 | $56,460 | $10,480 | $45,980 |
| 2021 | $8,051 | $58,080 | $10,780 | $47,300 |
| 2020 | $7,655 | $54,500 | $10,040 | $44,460 |
| 2019 | $7,686 | $54,880 | $10,110 | $44,770 |
| 2018 | $7,705 | $52,260 | $7,920 | $44,340 |
| 2017 | $7,209 | $57,780 | $8,760 | $49,020 |
| 2016 | $7,124 | $49,040 | $8,760 | $40,280 |
Source: Public Records
Map
Nearby Homes
- 4620 Belford Cir
- 16010 Quandary Loop
- 15965 Wetterhorn Way
- 16545 Antero Cir
- 15932 Torreys Way
- 16538 Chesapeake Dr
- 3746 Yale Dr
- 16631 Las Brisas Dr
- 3716 Yale Dr
- 4112 Centennial Dr
- 15689 Columbus Mountain Dr
- 4620 White Rock Dr
- 4760 White Rock Dr
- 16392 Spanish Peak Way
- 16611 Plateau Ln
- 3481 Vestal Loop
- 3431 Vestal Loop
- 15958 Humboldt Peak Dr
- 3301 Traver Dr
- 1465 Blue Sky Cir Unit 17-204
- 4514 Silver Mountain Loop
- 4510 Silver Mountain Loop
- 4516 Silver Mountain Loop
- 4683 Belford Cir
- 4513 Silver Mountain Loop
- 4681 Belford Cir
- 4685 Belford Cir
- 4515 Silver Mountain Loop
- 4506 Silver Mountain Loop
- 4679 Belford Cir
- 4687 Belford Cir
- 4517 Silver Mountain Loop
- 16234 Cirque Mountain Way
- 4677 Belford Cir
- 16223 Cirque Mountain Way
- 4689 Belford Cir
- 4504 Silver Mountain Loop
- 16244 Cirque Mountain Way
- 4675 Belford Cir
- 4590 Silver Mountain Loop
Your Personal Tour Guide
Ask me questions while you tour the home.