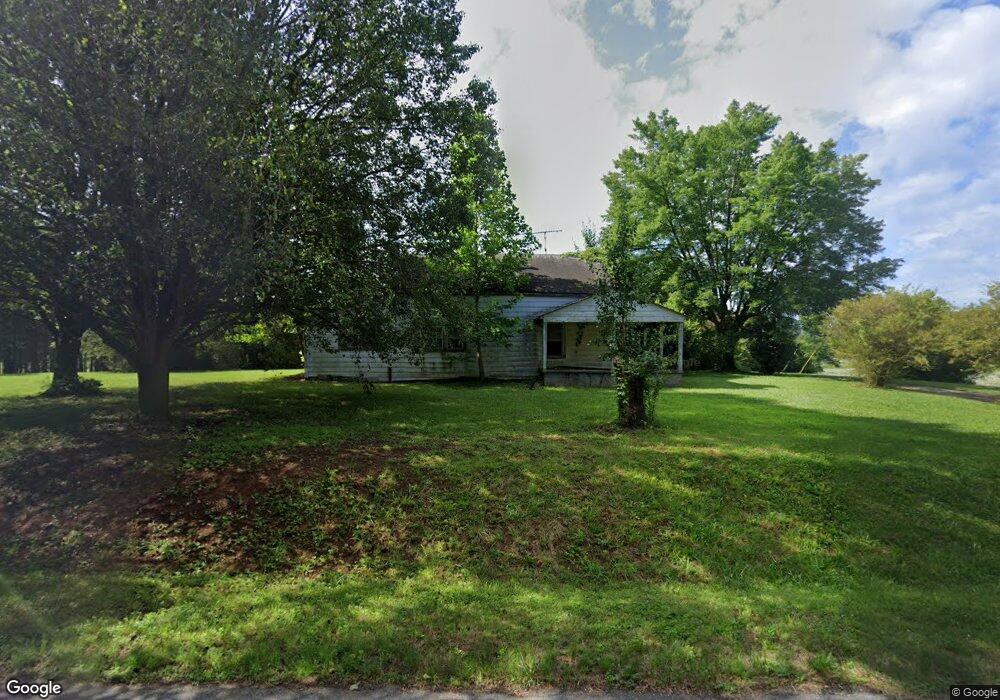
4512 Thomas Rd East Bend, NC 27018
Estimated Value: $184,615 - $319,000
2
Beds
1
Bath
1,478
Sq Ft
$177/Sq Ft
Est. Value
About This Home
This home is located at 4512 Thomas Rd, East Bend, NC 27018 and is currently estimated at $261,404, approximately $176 per square foot. 4512 Thomas Rd is a home located in Yadkin County.
Ownership History
Date
Name
Owned For
Owner Type
Purchase Details
Closed on
Jan 17, 2007
Sold by
Thomas James F and Thomas Lottie J
Bought by
Thomas Franklin M
Current Estimated Value
Purchase Details
Closed on
Jan 4, 2007
Sold by
Thomas James F and Thomas Lottie J
Bought by
Thomas Franklin M
Purchase Details
Closed on
Oct 24, 2006
Sold by
Thomas Kevin and Thomas Vanessa M
Bought by
Thomas Franklin M
Purchase Details
Closed on
Aug 28, 2006
Sold by
Thomas Christopher and Thomas Mary W
Bought by
Thomas Kevin
Purchase Details
Closed on
Feb 17, 2006
Sold by
Latinwo Gina
Bought by
Thomas Franklin M
Purchase Details
Closed on
Feb 16, 2006
Sold by
Thomas Ronald D
Bought by
Thomas Franklin M
Purchase Details
Closed on
Feb 15, 2006
Sold by
Thomas Cedric and Thomas Rosa
Bought by
Thomas Franklin M
Purchase Details
Closed on
Aug 31, 2005
Sold by
Thomas Roy A
Bought by
Thomas Franklin M
Create a Home Valuation Report for This Property
The Home Valuation Report is an in-depth analysis detailing your home's value as well as a comparison with similar homes in the area
Home Values in the Area
Average Home Value in this Area
Purchase History
| Date | Buyer | Sale Price | Title Company |
|---|---|---|---|
| Thomas Franklin M | -- | None Available | |
| Thomas Franklin M | -- | None Available | |
| Thomas Franklin M | -- | None Available | |
| Thomas Kevin | $19,000 | None Available | |
| Thomas Franklin M | $8,000 | None Available | |
| Thomas Franklin M | $8,000 | None Available | |
| Thomas Franklin M | $8,000 | None Available | |
| Thomas Franklin M | $8,000 | None Available | |
| Thomas Franklin M | $85,000 | None Available |
Source: Public Records
Tax History Compared to Growth
Tax History
| Year | Tax Paid | Tax Assessment Tax Assessment Total Assessment is a certain percentage of the fair market value that is determined by local assessors to be the total taxable value of land and additions on the property. | Land | Improvement |
|---|---|---|---|---|
| 2025 | $648 | $91,850 | $47,328 | $44,522 |
| 2024 | $643 | $91,850 | $47,328 | $44,522 |
| 2023 | $430 | $91,850 | $47,328 | $44,522 |
| 2022 | $430 | $59,816 | $43,025 | $16,791 |
| 2021 | $271 | $37,703 | $20,912 | $16,791 |
| 2020 | $271 | $37,703 | $20,912 | $16,791 |
| 2019 | $271 | $37,703 | $20,912 | $16,791 |
| 2018 | $276 | $37,703 | $20,912 | $16,791 |
| 2017 | $269 | $37,703 | $20,912 | $16,791 |
| 2016 | $414 | $58,057 | $38,475 | $19,582 |
| 2015 | $422 | $58,057 | $38,475 | $19,582 |
| 2014 | $422 | $58,057 | $38,475 | $19,582 |
| 2013 | $433 | $58,057 | $38,475 | $19,582 |
Source: Public Records
Map
Nearby Homes
- 0 Benbow Dr
- 317 Benbow Dr
- 0 Flint Hill Rd Unit 1193666
- 01 N Carolina 67
- 209 River St
- 212 River St
- 3924 Prides Rd
- 405 Oak St
- 0 Shady Grove Church Rd
- 3753 Prides Rd
- 4933 Wrenn Rd
- 1080 Autumn Dr
- 4235 Shady Grove Church Rd
- 2628 Bloomtown Rd
- 4600 River Bluff Farms Rd
- 9981 Sprinkle Ferry Rd
- 5611 Stone Ridge Dr
- 8040 Crosscreek Trail
- 3013 Spillman Frye Ln
- 1105 Cabana Ln
- 4505 Thomas Rd
- 4524 Thomas Rd
- 3205 Flint Hill Rd
- 4641 Mount Bethel Church Rd
- 3225 Flint Hill Rd
- 4612 Thomas Rd
- 4646 Mount Bethel Church Rd
- 3249 Flint Hill Rd
- 4624 Thomas Rd
- 3285 Flint Hill Rd
- 4625 Thomas Rd
- 3312 Flint Hill Rd
- 4609 Mount Bethel Church Rd
- 4641 Thomas Rd
- 000 Araby Ln
- 000 Araby Ln Unit 5
- 3337 Flint Hill Rd
- 3015 Raven Hill Dr
- 3013 Raven Hill Dr
- 4552 Mount Bethel Church Rd