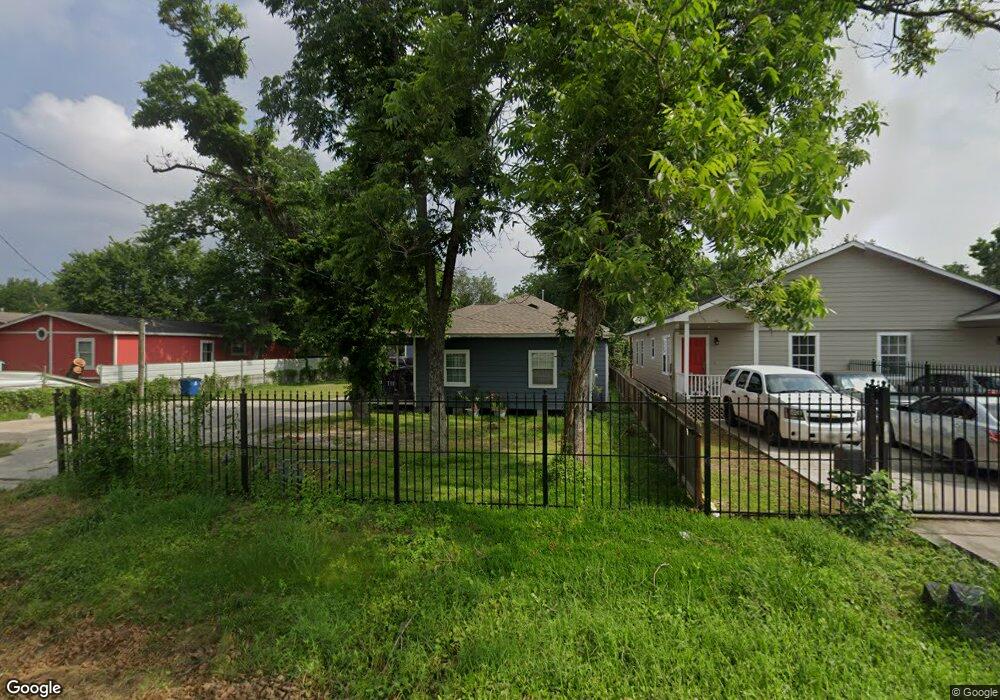
4513 Mohawk St Houston, TX 77093
East Aldine NeighborhoodEstimated Value: $126,000 - $260,000
5
Beds
3
Baths
2,100
Sq Ft
$88/Sq Ft
Est. Value
About This Home
This home is located at 4513 Mohawk St, Houston, TX 77093 and is currently estimated at $185,068, approximately $88 per square foot. 4513 Mohawk St is a home located in Harris County with nearby schools including Escamilla Elementary School, Macarthur Ninth Grade School, and Hambrick Middle School.
Ownership History
Date
Name
Owned For
Owner Type
Purchase Details
Closed on
Jan 5, 2015
Sold by
Segovia Gloria Ramirez
Bought by
Magallanes Ramirez Mario Alberto and Bocanegra Hernandez Yulma Yadira
Current Estimated Value
Purchase Details
Closed on
Nov 6, 2012
Sold by
Gonzales Pablo
Bought by
Vazquez Yolanda
Purchase Details
Closed on
Sep 28, 2012
Sold by
Deanda Dean
Bought by
Setgovia Gloria Ramirez
Purchase Details
Closed on
Sep 26, 2012
Sold by
Garcia Maria
Bought by
Deanda Dean
Purchase Details
Closed on
Jun 5, 2012
Sold by
Deanda Dean
Bought by
Garcia Maria
Purchase Details
Closed on
Jun 4, 2012
Sold by
Reed Darlene M and The Estate Of Arvie B Milstead
Bought by
Deanda Dean
Create a Home Valuation Report for This Property
The Home Valuation Report is an in-depth analysis detailing your home's value as well as a comparison with similar homes in the area
Home Values in the Area
Average Home Value in this Area
Purchase History
| Date | Buyer | Sale Price | Title Company |
|---|---|---|---|
| Magallanes Ramirez Mario Alberto | -- | None Available | |
| Vazquez Yolanda | -- | None Available | |
| Setgovia Gloria Ramirez | -- | None Available | |
| Deanda Dean | -- | None Available | |
| Garcia Maria | -- | None Available | |
| Deanda Dean | -- | None Available |
Source: Public Records
Mortgage History
| Date | Status | Borrower | Loan Amount |
|---|---|---|---|
| Closed | Setgovia Gloria Ramirez | $0 |
Source: Public Records
Tax History Compared to Growth
Tax History
| Year | Tax Paid | Tax Assessment Tax Assessment Total Assessment is a certain percentage of the fair market value that is determined by local assessors to be the total taxable value of land and additions on the property. | Land | Improvement |
|---|---|---|---|---|
| 2025 | $3,493 | $279,676 | $53,250 | $226,426 |
| 2024 | $3,493 | $237,768 | $30,000 | $207,768 |
| 2023 | $3,493 | $150,458 | $30,000 | $120,458 |
| 2022 | $364 | $17,679 | $14,100 | $3,579 |
| 2021 | $3,039 | $141,014 | $17,625 | $123,389 |
| 2020 | $3,203 | $141,014 | $17,625 | $123,389 |
| 2019 | $3,355 | $141,014 | $17,625 | $123,389 |
| 2018 | $1,953 | $136,021 | $17,625 | $118,396 |
| 2017 | $3,083 | $136,021 | $17,625 | $118,396 |
| 2016 | $3,083 | $136,021 | $17,625 | $118,396 |
| 2015 | $972 | $43,607 | $17,625 | $25,982 |
| 2014 | $972 | $43,607 | $17,625 | $25,982 |
Source: Public Records
Map
Nearby Homes
- 11206 Eastex Fwy
- 4410 Shelton Rd
- 4415 Mooney Rd
- 11375 Allwood St
- 3804 Cedar Hill Ln
- 4007 Wedgewood St
- 9213 Washington St
- 0 Hopper Rd Unit 35613143
- 3418 Hopper Rd
- 0 Cedar Hill Ln Unit 45497108
- 4522 Collins Rd
- 5611 Yorkwood St
- 5613 Annunciation St
- 4809 Edgewater Dr
- 10627 Castleton St
- 5815 Mohawk St
- 5404 Mount Houston Rd
- 10606 Bucknell Rd
- 5618 Briarwick Ln
- 3214 Brea Crest St
- 4515 Mohawk St
- 4501 Mohawk St
- 4517 Mohawk St
- 4510 Hanley Ln
- 4506 Hanley Ln
- 4508 Hanley Ln
- 4502 Hanley Ln
- 4510 Mohawk St
- 4522 Hanley Ln
- 4522 Hanley Ln Unit A
- 4522 Hanley Ln Unit B
- 4518 Mohawk St
- 4502 Mohawk St
- 4526 Hanley Ln
- 4522 Mohawk St
- 4432 Hanley Ln
- 4417 Mohawk St
- 4417 Mohawk St
- 4430 Hanley Ln
- 4604 Hanley Ln