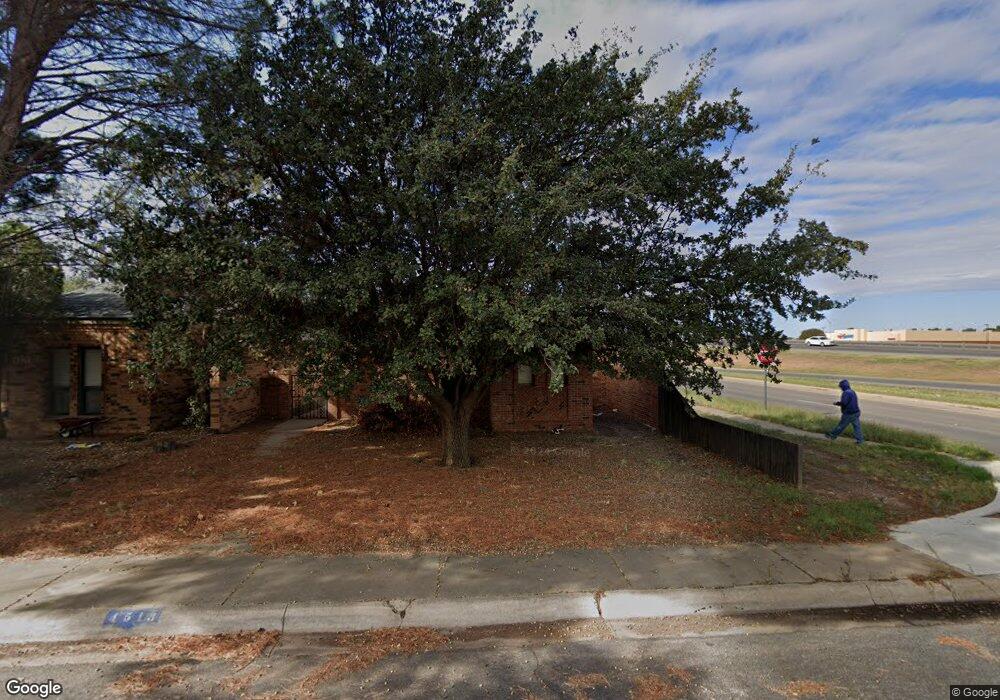
4513 Norwood St Midland, TX 79707
Skyline Terrace NeighborhoodEstimated Value: $220,000 - $229,579
2
Beds
2
Baths
1,356
Sq Ft
$166/Sq Ft
Est. Value
About This Home
This home is located at 4513 Norwood St, Midland, TX 79707 and is currently estimated at $224,895, approximately $165 per square foot. 4513 Norwood St is a home located in Midland County with nearby schools including Parker Elementary School, Alamo Junior High School, and Trinity School of Midland.
Ownership History
Date
Name
Owned For
Owner Type
Purchase Details
Closed on
Nov 14, 2024
Sold by
Williamson Stephenson Larry and Cloninger Terry S
Bought by
Wakefield Beth M and Wakefield Christopher D
Current Estimated Value
Home Financials for this Owner
Home Financials are based on the most recent Mortgage that was taken out on this home.
Original Mortgage
$171,200
Outstanding Balance
$169,320
Interest Rate
6.12%
Mortgage Type
New Conventional
Estimated Equity
$55,575
Purchase Details
Closed on
Jul 28, 2011
Sold by
Swafford Debra Lynn
Bought by
Swafford Raymond Lee
Purchase Details
Closed on
Jul 1, 1988
Bought by
Stephenson Larry W
Purchase Details
Closed on
Jan 28, 1988
Bought by
Stephenson Larry W
Purchase Details
Closed on
Aug 21, 1985
Bought by
Stephenson Larry W
Purchase Details
Closed on
Jan 4, 1983
Bought by
Stephenson Larry W
Create a Home Valuation Report for This Property
The Home Valuation Report is an in-depth analysis detailing your home's value as well as a comparison with similar homes in the area
Home Values in the Area
Average Home Value in this Area
Purchase History
| Date | Buyer | Sale Price | Title Company |
|---|---|---|---|
| Wakefield Beth M | -- | Lone Star Abstract & Title | |
| Swafford Raymond Lee | -- | None Available | |
| Stephenson Larry W | -- | -- | |
| Stephenson Larry W | -- | -- | |
| Stephenson Larry W | -- | -- | |
| Stephenson Larry W | -- | -- |
Source: Public Records
Mortgage History
| Date | Status | Borrower | Loan Amount |
|---|---|---|---|
| Open | Wakefield Beth M | $171,200 |
Source: Public Records
Tax History Compared to Growth
Tax History
| Year | Tax Paid | Tax Assessment Tax Assessment Total Assessment is a certain percentage of the fair market value that is determined by local assessors to be the total taxable value of land and additions on the property. | Land | Improvement |
|---|---|---|---|---|
| 2025 | $2,659 | $206,550 | $12,710 | $193,840 |
| 2024 | $2,663 | $175,340 | $12,710 | $162,630 |
| 2023 | $2,551 | $170,220 | $12,710 | $157,510 |
| 2022 | $2,625 | $168,040 | $12,710 | $155,330 |
| 2021 | $2,854 | $163,800 | $12,710 | $151,090 |
| 2020 | $1,433 | $164,070 | $12,710 | $151,360 |
| 2019 | $2,893 | $152,810 | $12,710 | $151,360 |
| 2018 | $2,701 | $138,920 | $12,710 | $126,210 |
| 2017 | $2,603 | $133,890 | $12,710 | $121,180 |
| 2016 | $2,423 | $132,370 | $12,710 | $119,660 |
| 2015 | -- | $126,940 | $12,710 | $119,660 |
| 2014 | -- | $123,820 | $12,710 | $111,110 |
Source: Public Records
Map
Nearby Homes
- 4512 Norwood St
- 4502 Parkhurst Dr
- 4000 W Loop 250 N
- 4002 Crestwood Ave
- 4505 Westminister Dr
- 3907 Westminister Dr
- 4500 Westminister Dr
- 4307 Crestgate Ave
- 4003 Compton Dr
- 4700 Boulder Dr Unit 710
- 4700 Boulder Dr Unit 611
- 4700 Boulder Dr Unit 103
- 4700 Boulder Dr Unit 303
- 4700 Boulder Dr Unit 1112
- 4700 Boulder Dr Unit 1504
- 4700 Boulder Dr Unit 1605
- 4700 Boulder Dr
- 4700 Boulder Dr Unit 1303
- 4700 Boulder Dr Unit 1601
- 4700 Boulder Dr Unit 902
- 4511 Norwood St
- 4509 Norwood St
- 4507 Norwood St
- 4505 Norwood St
- 4510 Norwood St
- 4503 Norwood St
- 4508 Norwood St
- 4506 Norwood St
- 4501 Norwood St
- 4504 Norwood St
- 4502 Norwood St
- 4427 Norwood St
- 4500 Norwood St
- 4425 Norwood St
- 4505 Parkhurst Dr
- 4503 Parkhurst Dr
- 4423 Norwood St
- 4501 Parkhurst Dr
- 4421 Norwood St
- 4418 Norwood St