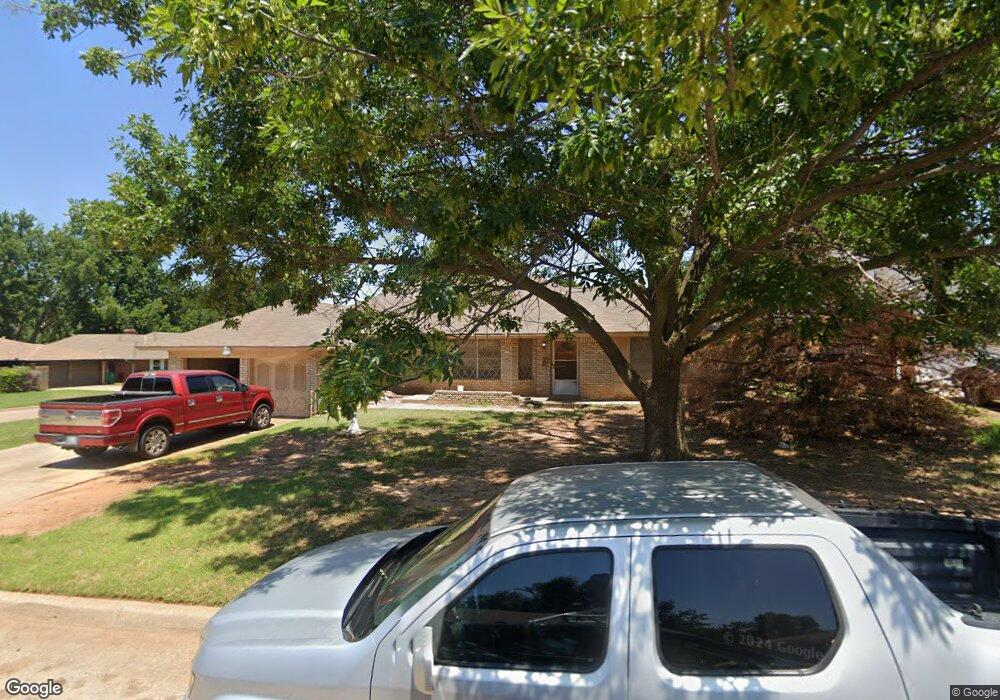
4513 NW 31st St Oklahoma City, OK 73122
Windsor Hills NeighborhoodEstimated Value: $214,057 - $242,000
3
Beds
2
Baths
1,842
Sq Ft
$121/Sq Ft
Est. Value
About This Home
This home is located at 4513 NW 31st St, Oklahoma City, OK 73122 and is currently estimated at $223,764, approximately $121 per square foot. 4513 NW 31st St is a home located in Oklahoma County with nearby schools including Windsor Hills Elementary School, Mayfield Middle School, and Putnam City West High School.
Ownership History
Date
Name
Owned For
Owner Type
Purchase Details
Closed on
Mar 18, 2008
Sold by
Miller Rebecca Jane
Bought by
Miller Sara Jane
Current Estimated Value
Purchase Details
Closed on
Mar 13, 2008
Sold by
Miller Gerald Edward and Miller Stacey Anne
Bought by
Miller Sara Jane
Purchase Details
Closed on
May 1, 2001
Sold by
Mcmurtry Chloe
Bought by
Mcmurtry Management & Investments Llc
Purchase Details
Closed on
Mar 22, 2000
Sold by
Walker Anita Sue and Miller Gerald E
Bought by
Mcmurtry Family Trust
Purchase Details
Closed on
Oct 30, 1998
Sold by
Miller Ronald I
Bought by
Walker Anita Sue
Purchase Details
Closed on
Oct 10, 1998
Sold by
Miller Ina B
Bought by
Miller Ronald I and Miller Gerald E
Create a Home Valuation Report for This Property
The Home Valuation Report is an in-depth analysis detailing your home's value as well as a comparison with similar homes in the area
Home Values in the Area
Average Home Value in this Area
Purchase History
| Date | Buyer | Sale Price | Title Company |
|---|---|---|---|
| Miller Sara Jane | -- | None Available | |
| Miller Sara Jane | -- | None Available | |
| Miller Sara Jane | -- | None Available | |
| Mcmurtry Management & Investments Llc | -- | -- | |
| Mcmurtry Management & Investments Llc | -- | -- | |
| Mcmurtry Management & Investments Llc | -- | -- | |
| Mcmurtry Management & Investments Llc | -- | -- | |
| Mcmurtry Family Trust | $96,500 | U S Title & Escrow Corp | |
| Walker Anita Sue | -- | -- | |
| Miller Ronald I | -- | -- |
Source: Public Records
Tax History Compared to Growth
Tax History
| Year | Tax Paid | Tax Assessment Tax Assessment Total Assessment is a certain percentage of the fair market value that is determined by local assessors to be the total taxable value of land and additions on the property. | Land | Improvement |
|---|---|---|---|---|
| 2024 | $2,345 | $20,194 | $3,866 | $16,328 |
| 2023 | $2,345 | $19,232 | $2,918 | $16,314 |
| 2022 | $2,260 | $18,316 | $3,126 | $15,190 |
| 2021 | $2,132 | $17,444 | $3,475 | $13,969 |
| 2020 | $2,022 | $16,614 | $3,546 | $13,068 |
| 2019 | $1,897 | $15,823 | $3,012 | $12,811 |
| 2018 | $1,809 | $15,070 | $0 | $0 |
| 2017 | $1,785 | $14,841 | $3,044 | $11,797 |
| 2016 | $1,697 | $14,134 | $3,068 | $11,066 |
| 2015 | $1,666 | $13,716 | $3,272 | $10,444 |
| 2014 | $1,556 | $13,319 | $3,272 | $10,047 |
Source: Public Records
Map
Nearby Homes
- 4612 NW 33rd Terrace
- 4612 NW 33rd Dr
- 4608 NW 34th St
- 2800 N Meridian Ct
- 2805 Tudor Rd
- 4621 NW 34th St
- 4504 NW 26th St Unit 4504-4506
- 2900 N Windsor Blvd
- 4517 NW 25th Place
- 2704 N Harvard Ave
- 3508 N Ann Arbor Place
- 2613 N Windsor Place
- 2924 N Vermont Ave
- 4900 NW 34th St
- 4908 NW 32nd St
- 3823 N Harvard Ave Unit 12
- 4901 NW 34th St
- 3020 N Zedna Dr
- 4838 NW 26th St
- 4113 Mason Dr
- 4509 NW 31st St
- 4512 NW 32nd St
- 4508 NW 32nd St
- 3201 N Meridian Ct
- 4505 NW 31st St
- 4512 NW 31st St
- 3129 N Meridian Ct
- 3205 N Meridian Ct
- 4508 NW 31st St
- 4504 NW 32nd St
- 3125 N Meridian Ct
- 3209 N Meridian Ct
- 4504 NW 31st St
- 4501 NW 31st St
- 4500 NW 32nd St
- 3121 N Meridian Ct
- 4513 NW 31st Place
- 4500 NW 31st St
- 4509 NW 31st Place
- 4513 NW 32nd St