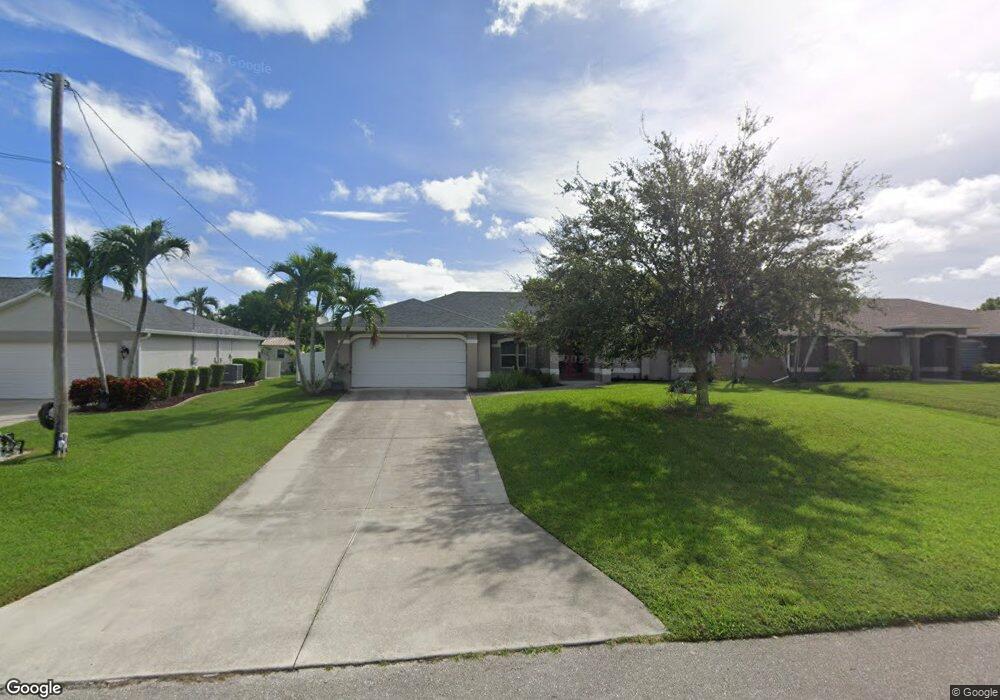
4513 SW 10th Ave Cape Coral, FL 33914
Pelican NeighborhoodEstimated Value: $391,493 - $486,000
3
Beds
2
Baths
1,819
Sq Ft
$238/Sq Ft
Est. Value
About This Home
This home is located at 4513 SW 10th Ave, Cape Coral, FL 33914 and is currently estimated at $432,873, approximately $237 per square foot. 4513 SW 10th Ave is a home located in Lee County with nearby schools including Cape Elementary School, Caloosa Elementary School, and Tropic Isles Elementary School.
Ownership History
Date
Name
Owned For
Owner Type
Purchase Details
Closed on
Aug 29, 2005
Sold by
Moseley Peyton and Moseley Holley Renee
Bought by
Forgays Brian Robert and Mancera Heather Maria
Current Estimated Value
Home Financials for this Owner
Home Financials are based on the most recent Mortgage that was taken out on this home.
Original Mortgage
$50,000
Interest Rate
5.71%
Mortgage Type
Unknown
Purchase Details
Closed on
Jul 30, 2004
Sold by
Schoenfelt Mark R
Bought by
Heller Holley Renee and Moseley Peyton
Home Financials for this Owner
Home Financials are based on the most recent Mortgage that was taken out on this home.
Original Mortgage
$179,200
Interest Rate
8.3%
Mortgage Type
Unknown
Purchase Details
Closed on
Jun 6, 2003
Sold by
Cape Holdings Ent Inc
Bought by
Schoenfelt Mark R
Home Financials for this Owner
Home Financials are based on the most recent Mortgage that was taken out on this home.
Original Mortgage
$180,000
Interest Rate
5.43%
Create a Home Valuation Report for This Property
The Home Valuation Report is an in-depth analysis detailing your home's value as well as a comparison with similar homes in the area
Home Values in the Area
Average Home Value in this Area
Purchase History
| Date | Buyer | Sale Price | Title Company |
|---|---|---|---|
| Forgays Brian Robert | $330,000 | Platinum Land Title Agency I | |
| Heller Holley Renee | $224,000 | Lawyers Advantage Title Grou | |
| Schoenfelt Mark R | $12,500 | -- |
Source: Public Records
Mortgage History
| Date | Status | Borrower | Loan Amount |
|---|---|---|---|
| Closed | Forgays Brian Robert | $50,000 | |
| Previous Owner | Heller Holley Renee | $179,200 | |
| Previous Owner | Schoenfelt Mark R | $180,000 |
Source: Public Records
Tax History Compared to Growth
Tax History
| Year | Tax Paid | Tax Assessment Tax Assessment Total Assessment is a certain percentage of the fair market value that is determined by local assessors to be the total taxable value of land and additions on the property. | Land | Improvement |
|---|---|---|---|---|
| 2025 | $3,516 | $152,351 | -- | -- |
| 2024 | $3,400 | $148,057 | -- | -- |
| 2023 | $3,400 | $143,745 | $0 | $0 |
| 2022 | $3,208 | $139,558 | $0 | $0 |
| 2021 | $3,184 | $250,239 | $44,740 | $205,499 |
| 2020 | $3,073 | $133,622 | $0 | $0 |
| 2019 | $2,868 | $123,604 | $0 | $0 |
| 2018 | $2,733 | $115,172 | $0 | $0 |
| 2017 | $2,812 | $117,413 | $0 | $0 |
| 2016 | $2,795 | $198,743 | $22,100 | $176,643 |
| 2015 | $2,786 | $174,005 | $17,045 | $156,960 |
| 2014 | $2,735 | $152,795 | $15,457 | $137,338 |
| 2013 | -- | $139,006 | $13,041 | $125,965 |
Source: Public Records
Map
Nearby Homes
- 4403 SW 10th Ave
- 4513 SW 9th Ave
- 2422 SW 11th Ave
- 2418 SW 11th Ave
- 4334 SW 9th Place
- 4513 SW 8th Ct Unit 109
- 4513 SW 8th Ct Unit 113
- 4513 SW 8th Ct Unit 117
- 4514 SW 8th Place Unit 11
- 1109 SW 44th St
- 4520 Skyline Blvd Unit 208
- 1103 SW 47th St
- 4219 SW 10th Ave
- 4602 Skyline Blvd
- 1140 SW 45th Terrace
- 1003 SW 47th Terrace Unit 201
- 1145 SW 44th Terrace
- 4616 Skyline Blvd Unit 104
- 841 SW 47th Terrace Unit 202
- 4528 SW 7th Place
- 4517 SW 10th Ave
- 4427 SW 10th Ave
- 4518 SW 9th Place
- 4428 SW 9th Place
- 4423 SW 10th Ave Unit 65
- 4521 SW 10th Ave
- 4424 SW 9th Place
- 4520 SW 9th Place
- 4516 SW 10th Ave Unit 201
- 4428 SW 10th Ave
- 4520 SW 10th Ave
- 4420 SW 9th Place
- 4525 SW 10th Ave
- 4424 SW 10th Ave
- 4419 SW 10th Ave
- 4524 SW 10th Ave
- 4429 SW 9th Place
- 4513 SW 9th Place
- 4528 SW 9th Place
- 4427 SW 9th Place