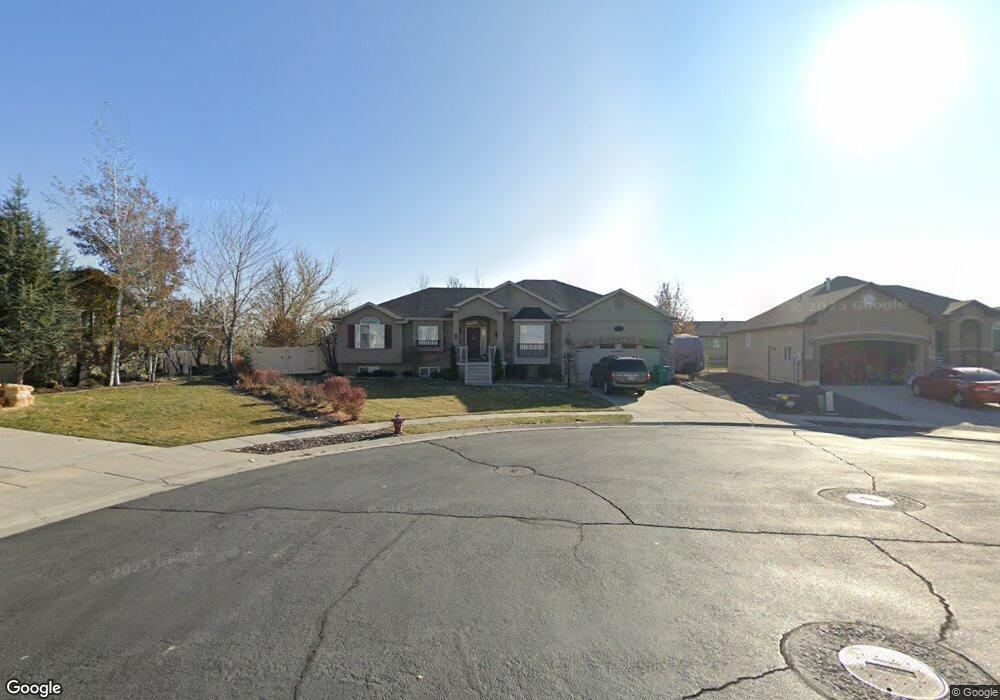
4513 W 5625 S Hooper, UT 84315
Estimated Value: $588,000 - $639,000
3
Beds
1
Bath
2,096
Sq Ft
$294/Sq Ft
Est. Value
About This Home
This home is located at 4513 W 5625 S, Hooper, UT 84315 and is currently estimated at $616,276, approximately $294 per square foot. 4513 W 5625 S is a home located in Weber County with nearby schools including Freedom School, Roy Junior High School, and Roy High School.
Ownership History
Date
Name
Owned For
Owner Type
Purchase Details
Closed on
Apr 29, 2009
Sold by
Chugg Cody E and Chugg Candice D
Bought by
Chugg Cody E and Chugg Candice D
Current Estimated Value
Home Financials for this Owner
Home Financials are based on the most recent Mortgage that was taken out on this home.
Original Mortgage
$257,600
Outstanding Balance
$162,319
Interest Rate
4.8%
Mortgage Type
Purchase Money Mortgage
Estimated Equity
$453,957
Purchase Details
Closed on
Apr 6, 2007
Sold by
Chugg Cody
Bought by
Chugg Cody and Chugg Candice
Purchase Details
Closed on
Jan 25, 2007
Sold by
Mike Schultz Construction Inc
Bought by
Chugg Cody
Home Financials for this Owner
Home Financials are based on the most recent Mortgage that was taken out on this home.
Original Mortgage
$253,634
Interest Rate
6.1%
Mortgage Type
Purchase Money Mortgage
Purchase Details
Closed on
Nov 10, 2005
Sold by
Larsen Brad S and Tremelling Janet M
Bought by
Mike Schultz Construction Inc
Create a Home Valuation Report for This Property
The Home Valuation Report is an in-depth analysis detailing your home's value as well as a comparison with similar homes in the area
Home Values in the Area
Average Home Value in this Area
Purchase History
| Date | Buyer | Sale Price | Title Company |
|---|---|---|---|
| Chugg Cody E | -- | None Available | |
| Chugg Cody | -- | Gt Title | |
| Chugg Cody | -- | Heritage West | |
| Mike Schultz Construction Inc | -- | Heritage West Title Insuranc |
Source: Public Records
Mortgage History
| Date | Status | Borrower | Loan Amount |
|---|---|---|---|
| Open | Chugg Cody E | $257,600 | |
| Closed | Chugg Cody | $253,634 |
Source: Public Records
Tax History Compared to Growth
Tax History
| Year | Tax Paid | Tax Assessment Tax Assessment Total Assessment is a certain percentage of the fair market value that is determined by local assessors to be the total taxable value of land and additions on the property. | Land | Improvement |
|---|---|---|---|---|
| 2025 | $3,538 | $596,849 | $205,505 | $391,344 |
| 2024 | $3,575 | $339,349 | $113,027 | $226,322 |
| 2023 | $3,261 | $304,150 | $112,152 | $191,998 |
| 2022 | $3,421 | $328,900 | $87,254 | $241,646 |
| 2021 | $2,905 | $467,000 | $113,061 | $353,939 |
| 2020 | $2,672 | $394,000 | $108,002 | $285,998 |
| 2019 | $2,671 | $373,000 | $105,255 | $267,745 |
| 2018 | $2,704 | $362,000 | $69,942 | $292,058 |
| 2017 | $2,778 | $362,000 | $68,761 | $293,239 |
| 2016 | $2,819 | $199,335 | $37,291 | $162,044 |
| 2015 | $2,709 | $188,838 | $34,510 | $154,328 |
| 2014 | $2,443 | $164,607 | $29,232 | $135,375 |
Source: Public Records
Map
Nearby Homes
- 4632 W 5750 S
- 4700 W 5500 S
- 4309 W 5430 St #B S
- 4449 W 5325 S
- 4337 W 5430 S Unit A
- 462 S 4450 W Unit 504
- 5539 S 4175 W
- 4438 W 6025 S
- 5644 S 4075 W
- 4909 W 5850 S
- 4276 W 6025 S
- 4164 W 5950 S
- 5465 S 4050 W
- 5778 S 4075 W
- 5270 S 4200 W
- 5116 S 4300 W
- 3016 W 2650 N
- 2571 N 3200 W
- 3028 W 2600 N
- 2616 N 3020 W