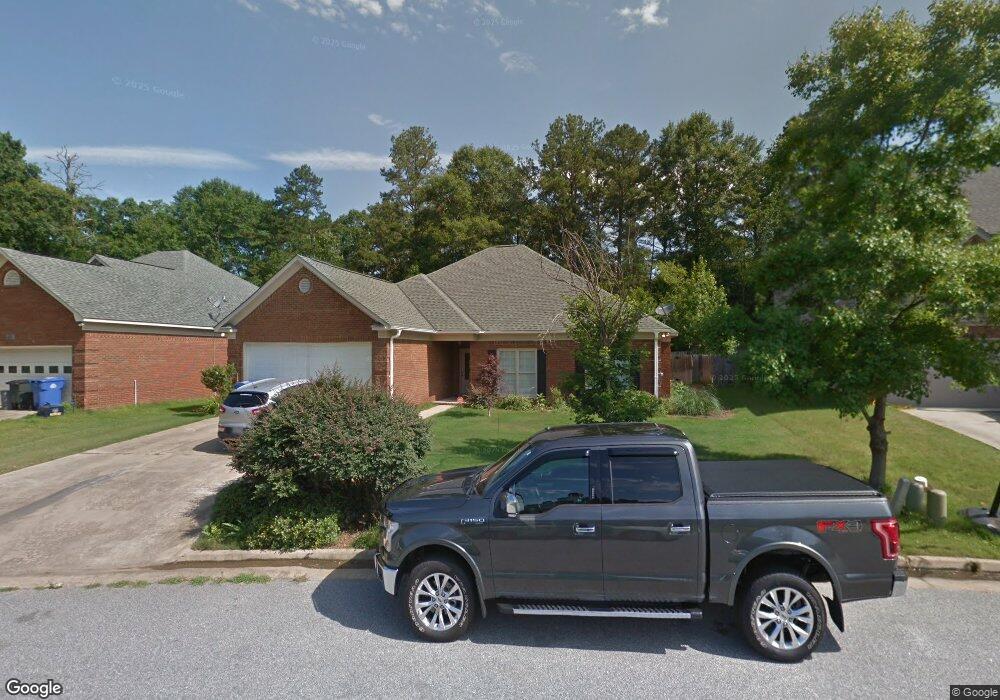
4513 Warner Ct Columbus, GA 31909
North Columbus NeighborhoodEstimated Value: $279,887 - $334,000
4
Beds
2
Baths
2,145
Sq Ft
$143/Sq Ft
Est. Value
About This Home
This home is located at 4513 Warner Ct, Columbus, GA 31909 and is currently estimated at $307,472, approximately $143 per square foot. 4513 Warner Ct is a home located in Muscogee County with nearby schools including Gentian Elementary School, Blackmon Road Middle School, and Hardaway High School.
Ownership History
Date
Name
Owned For
Owner Type
Purchase Details
Closed on
Jul 2, 2019
Sold by
Branch Michael
Bought by
Cesar Maxo Lee
Current Estimated Value
Home Financials for this Owner
Home Financials are based on the most recent Mortgage that was taken out on this home.
Original Mortgage
$211,700
Outstanding Balance
$185,468
Interest Rate
3.82%
Estimated Equity
$122,004
Purchase Details
Closed on
Mar 25, 2016
Sold by
Shelton Kristen L
Bought by
Branch Michael and Branch Ivelina
Home Financials for this Owner
Home Financials are based on the most recent Mortgage that was taken out on this home.
Original Mortgage
$203,278
Interest Rate
3.62%
Purchase Details
Closed on
Jun 21, 2007
Sold by
Keystone Builders Inc
Bought by
Shelton Brian D and Shelton Kristen L
Home Financials for this Owner
Home Financials are based on the most recent Mortgage that was taken out on this home.
Original Mortgage
$183,920
Interest Rate
6.16%
Mortgage Type
Purchase Money Mortgage
Create a Home Valuation Report for This Property
The Home Valuation Report is an in-depth analysis detailing your home's value as well as a comparison with similar homes in the area
Home Values in the Area
Average Home Value in this Area
Purchase History
| Date | Buyer | Sale Price | Title Company |
|---|---|---|---|
| Cesar Maxo Lee | $211,700 | -- | |
| Branch Michael | $199,000 | -- | |
| Shelton Brian D | $229,900 | None Available |
Source: Public Records
Mortgage History
| Date | Status | Borrower | Loan Amount |
|---|---|---|---|
| Open | Cesar Maxo Lee | $211,700 | |
| Previous Owner | Branch Michael | $203,278 | |
| Previous Owner | Shelton Brian D | $183,920 |
Source: Public Records
Tax History
| Year | Tax Paid | Tax Assessment Tax Assessment Total Assessment is a certain percentage of the fair market value that is determined by local assessors to be the total taxable value of land and additions on the property. | Land | Improvement |
|---|---|---|---|---|
| 2025 | $2,902 | $107,580 | $12,284 | $95,296 |
| 2024 | $290 | $107,580 | $12,284 | $95,296 |
| 2023 | $2,225 | $107,580 | $12,284 | $95,296 |
| 2022 | $3,026 | $87,328 | $12,284 | $75,044 |
| 2021 | $3,158 | $77,352 | $12,284 | $65,068 |
| 2020 | $3,159 | $77,352 | $12,284 | $65,068 |
| 2019 | $3,195 | $77,988 | $12,284 | $65,704 |
| 2018 | $3,195 | $77,988 | $12,284 | $65,704 |
| 2017 | $3,205 | $77,988 | $12,284 | $65,704 |
| 2016 | $3,316 | $93,648 | $15,400 | $78,248 |
| 2015 | $3,320 | $93,648 | $15,400 | $78,248 |
| 2014 | $3,325 | $93,648 | $15,400 | $78,248 |
| 2013 | -- | $93,648 | $15,400 | $78,248 |
Source: Public Records
Map
Nearby Homes
- 4847 Warm Springs Rd
- 6016 Warm Springs Ct
- 5926 Frazier Dr
- 6068 Bear Creek Ct
- 4437 Ansley Ave
- 5623 Hodges Dr
- 4320 Canady St
- 5619 Hodges Dr
- 6158 Arrington Dr
- 5621 Hodges Dr
- 4465 Weems Rd
- 5823 Pratt Ave
- 4849 Hearthstone Dr
- 4826 Miller Rd
- 6303 Lemans Ln
- 4017 Shade Valley Dr
- 5258 Cunningham Dr
- 5224 Miller Rd
- 4202 Cheshire Bridge Rd
- 5829 Moon Rd
- 4509 Warner Ct
- 4515 Warner Ct
- 4517 Warner Ct
- 4516 Warner Ct
- 4521 Warner Ct
- 5927 Warner Rd
- 4512 Warner Ct
- 4520 Warner Ct
- 5941 Warner Rd
- 4525 Warner Ct
- 4508 Warner Ct
- 4524 Warner Ct
- 4504 Warner Ct
- 4527 Warner Ct
- 4528 Warner Ct
- 4500 Warner Ct
- 4529 Warner Ct
- 4859 Warm Springs Rd
- 4532 Warner Ct
- 4871 Warm Springs Rd
Your Personal Tour Guide
Ask me questions while you tour the home.