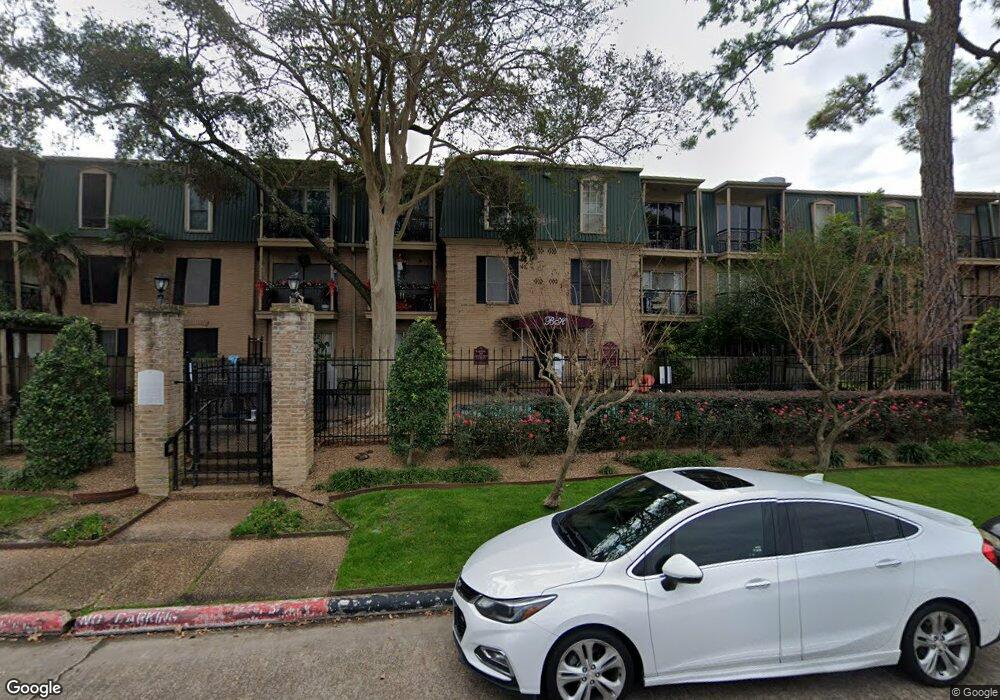
4515 Briar Hollow Place Unit 309 Houston, TX 77027
River Oaks NeighborhoodEstimated Value: $141,061 - $223,000
1
Bed
1
Bath
645
Sq Ft
$279/Sq Ft
Est. Value
About This Home
This home is located at 4515 Briar Hollow Place Unit 309, Houston, TX 77027 and is currently estimated at $179,765, approximately $278 per square foot. 4515 Briar Hollow Place Unit 309 is a home located in Harris County with nearby schools including School at St. George Place, Lanier Middle School, and Lamar High School.
Ownership History
Date
Name
Owned For
Owner Type
Purchase Details
Closed on
Dec 10, 2010
Sold by
Alvanipour Sarah
Bought by
Bravo Maricela
Current Estimated Value
Home Financials for this Owner
Home Financials are based on the most recent Mortgage that was taken out on this home.
Original Mortgage
$68,150
Outstanding Balance
$45,025
Interest Rate
4.22%
Mortgage Type
New Conventional
Estimated Equity
$134,740
Purchase Details
Closed on
Apr 25, 2006
Sold by
Alden Financial Inc
Bought by
Alvanipour Sarah
Home Financials for this Owner
Home Financials are based on the most recent Mortgage that was taken out on this home.
Original Mortgage
$73,920
Interest Rate
6.32%
Mortgage Type
Fannie Mae Freddie Mac
Purchase Details
Closed on
Mar 7, 2006
Sold by
Weaver Wayne
Bought by
Alden Financial Inc
Home Financials for this Owner
Home Financials are based on the most recent Mortgage that was taken out on this home.
Original Mortgage
$73,920
Interest Rate
6.32%
Mortgage Type
Fannie Mae Freddie Mac
Create a Home Valuation Report for This Property
The Home Valuation Report is an in-depth analysis detailing your home's value as well as a comparison with similar homes in the area
Home Values in the Area
Average Home Value in this Area
Purchase History
| Date | Buyer | Sale Price | Title Company |
|---|---|---|---|
| Bravo Maricela | -- | American Title Company | |
| Alvanipour Sarah | -- | American Title Co | |
| Alden Financial Inc | -- | American Title Co |
Source: Public Records
Mortgage History
| Date | Status | Borrower | Loan Amount |
|---|---|---|---|
| Open | Bravo Maricela | $68,150 | |
| Previous Owner | Alvanipour Sarah | $73,920 |
Source: Public Records
Tax History Compared to Growth
Tax History
| Year | Tax Paid | Tax Assessment Tax Assessment Total Assessment is a certain percentage of the fair market value that is determined by local assessors to be the total taxable value of land and additions on the property. | Land | Improvement |
|---|---|---|---|---|
| 2025 | $2,992 | $142,993 | $27,169 | $115,824 |
| 2024 | $2,992 | $142,993 | $27,169 | $115,824 |
| 2023 | $2,992 | $134,455 | $25,546 | $108,909 |
| 2022 | $2,643 | $120,047 | $22,809 | $97,238 |
| 2021 | $2,581 | $110,734 | $21,039 | $89,695 |
| 2020 | $2,682 | $110,734 | $21,039 | $89,695 |
| 2019 | $2,879 | $113,757 | $21,614 | $92,143 |
| 2018 | $2,879 | $113,757 | $21,614 | $92,143 |
| 2017 | $3,042 | $120,315 | $22,860 | $97,455 |
| 2016 | $3,042 | $120,315 | $22,860 | $97,455 |
| 2015 | $1,931 | $102,022 | $19,384 | $82,638 |
| 2014 | $1,931 | $75,106 | $14,270 | $60,836 |
Source: Public Records
Map
Nearby Homes
- 4515 Briar Hollow Place Unit 307
- 21 Briar Hollow Ln Unit 408
- 16 Stalynn Ln
- 20 Audubon Hollow Ln
- 28 Audubon Hollow Ln
- 20 Eaton Square
- 56 Audubon Hollow Ln
- 49 Briar Hollow Ln Unit 406
- 49 Briar Hollow Ln Unit 302
- 49 Briar Hollow Ln Unit 605
- 49 Briar Hollow Ln Unit 206
- 49 Briar Hollow Ln Unit 702
- 49 Briar Hollow Ln Unit 1801
- 49 Briar Hollow Ln Unit 1201
- 7 N Raintree Hollow Ln
- 4 River Hollow Ln
- 10 S Briar Hollow Ln Unit 87
- 10 S Briar Hollow Ln Unit 15
- 39 River Hollow Ln
- 6 River Hollow Ln
- 4515 Briar Hollow Place Unit 102
- 4515 Briar Hollow Place Unit 205
- 4515 Briar Hollow Place Unit 206
- 4515 Briar Hollow Place Unit 305
- 4515 Briar Hollow Place Unit 109
- 4515 Briar Hollow Place Unit 103
- 4515 Briar Hollow Place Unit 202
- 4515 Briar Hollow Place Unit 104
- 4515 Briar Hollow Place Unit 306
- 4515 Briar Hollow Place Unit 213
- 4515 Briar Hollow Place Unit 308
- 4515 Briar Hollow Place Unit 106
- 4515 Briar Hollow Place Unit 209
- 4515 Briar Hollow Place Unit 108
- 4515 Briar Hollow Place Unit 212
- 4515 Briar Hollow Place Unit 207
- 4515 Briar Hollow Place Unit 113
- 4515 Briar Hollow Place Unit 112
- 4515 Briar Hollow Place Unit 107
- 4515 Briar Hollow Place Unit 316