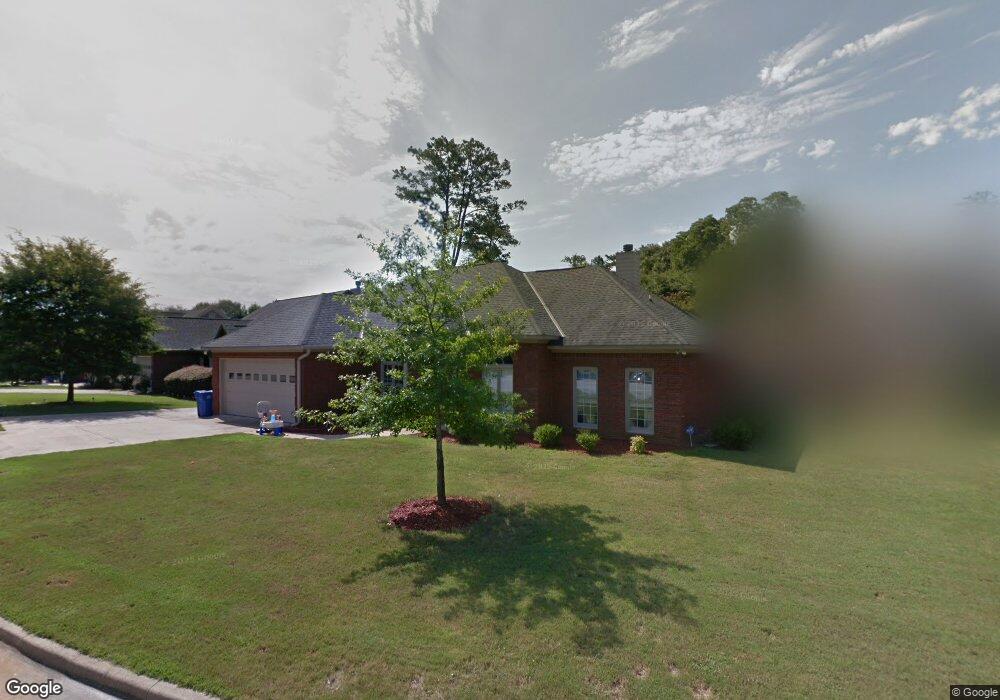
4516 Warner Ct Columbus, GA 31909
North Columbus NeighborhoodEstimated Value: $295,000 - $335,000
3
Beds
2
Baths
1,890
Sq Ft
$162/Sq Ft
Est. Value
About This Home
This home is located at 4516 Warner Ct, Columbus, GA 31909 and is currently estimated at $306,087, approximately $161 per square foot. 4516 Warner Ct is a home located in Muscogee County with nearby schools including Gentian Elementary School, Blackmon Road Middle School, and Hardaway High School.
Ownership History
Date
Name
Owned For
Owner Type
Purchase Details
Closed on
May 29, 2020
Sold by
Hackstall Roddney
Bought by
Williams Shannon D
Current Estimated Value
Home Financials for this Owner
Home Financials are based on the most recent Mortgage that was taken out on this home.
Original Mortgage
$207,157
Outstanding Balance
$183,629
Interest Rate
3.2%
Mortgage Type
VA
Estimated Equity
$122,458
Purchase Details
Closed on
Jul 16, 2013
Sold by
Hackstall Elise
Bought by
Hackstall Roddney
Home Financials for this Owner
Home Financials are based on the most recent Mortgage that was taken out on this home.
Original Mortgage
$215,432
Interest Rate
3.96%
Mortgage Type
VA
Purchase Details
Closed on
Feb 20, 2009
Sold by
Wade Wright
Bought by
Hackstall Roddney and Hackstall Elise
Home Financials for this Owner
Home Financials are based on the most recent Mortgage that was taken out on this home.
Original Mortgage
$223,708
Interest Rate
5.03%
Mortgage Type
VA
Create a Home Valuation Report for This Property
The Home Valuation Report is an in-depth analysis detailing your home's value as well as a comparison with similar homes in the area
Home Values in the Area
Average Home Value in this Area
Purchase History
| Date | Buyer | Sale Price | Title Company |
|---|---|---|---|
| Williams Shannon D | $202,500 | -- | |
| Hackstall Roddney | -- | -- | |
| Hackstall Roddney | $219,000 | None Available |
Source: Public Records
Mortgage History
| Date | Status | Borrower | Loan Amount |
|---|---|---|---|
| Open | Williams Shannon D | $207,157 | |
| Previous Owner | Hackstall Roddney | $215,432 | |
| Previous Owner | Hackstall Roddney | $223,708 |
Source: Public Records
Tax History
| Year | Tax Paid | Tax Assessment Tax Assessment Total Assessment is a certain percentage of the fair market value that is determined by local assessors to be the total taxable value of land and additions on the property. | Land | Improvement |
|---|---|---|---|---|
| 2025 | $3,280 | $120,780 | $12,304 | $108,476 |
| 2024 | $328 | $120,780 | $12,304 | $108,476 |
| 2023 | $2,605 | $120,780 | $12,304 | $108,476 |
| 2022 | $3,419 | $96,964 | $12,304 | $84,660 |
| 2021 | $3,307 | $81,000 | $11,360 | $69,640 |
| 2020 | $3,135 | $76,760 | $12,304 | $64,456 |
| 2019 | $3,145 | $76,760 | $12,304 | $64,456 |
| 2018 | $3,145 | $76,760 | $12,304 | $64,456 |
| 2017 | $3,155 | $76,760 | $12,304 | $64,456 |
| 2016 | $2,660 | $64,484 | $15,400 | $49,084 |
| 2015 | $2,663 | $64,484 | $15,400 | $49,084 |
| 2014 | $3,199 | $91,017 | $15,400 | $75,617 |
| 2013 | -- | $91,017 | $15,400 | $75,617 |
Source: Public Records
Map
Nearby Homes
- 4847 Warm Springs Rd
- 6016 Warm Springs Ct
- 5926 Frazier Dr
- 6068 Bear Creek Ct
- 5623 Hodges Dr
- 5619 Hodges Dr
- 5621 Hodges Dr
- 4437 Ansley Ave
- 4320 Canady St
- 6158 Arrington Dr
- 5823 Pratt Ave
- 4465 Weems Rd
- 4826 Miller Rd
- 4849 Hearthstone Dr
- 6303 Lemans Ln
- 4017 Shade Valley Dr
- 5258 Cunningham Dr
- 5224 Miller Rd
- 4202 Cheshire Bridge Rd
- 5829 Moon Rd
- 4520 Warner Ct
- 4512 Warner Ct
- 4524 Warner Ct
- 4508 Warner Ct
- 4509 Warner Ct
- 4513 Warner Ct
- 4515 Warner Ct
- 4521 Warner Ct
- 4528 Warner Ct
- 4504 Warner Ct
- 4525 Warner Ct
- 4517 Warner Ct
- 4859 Warm Springs Rd
- 4871 Warm Springs Rd
- 4500 Warner Ct
- 4532 Warner Ct
- 4527 Warner Ct
- 5927 Warner Rd
- 4841 Warm Springs Rd
- 4529 Warner Ct
Your Personal Tour Guide
Ask me questions while you tour the home.