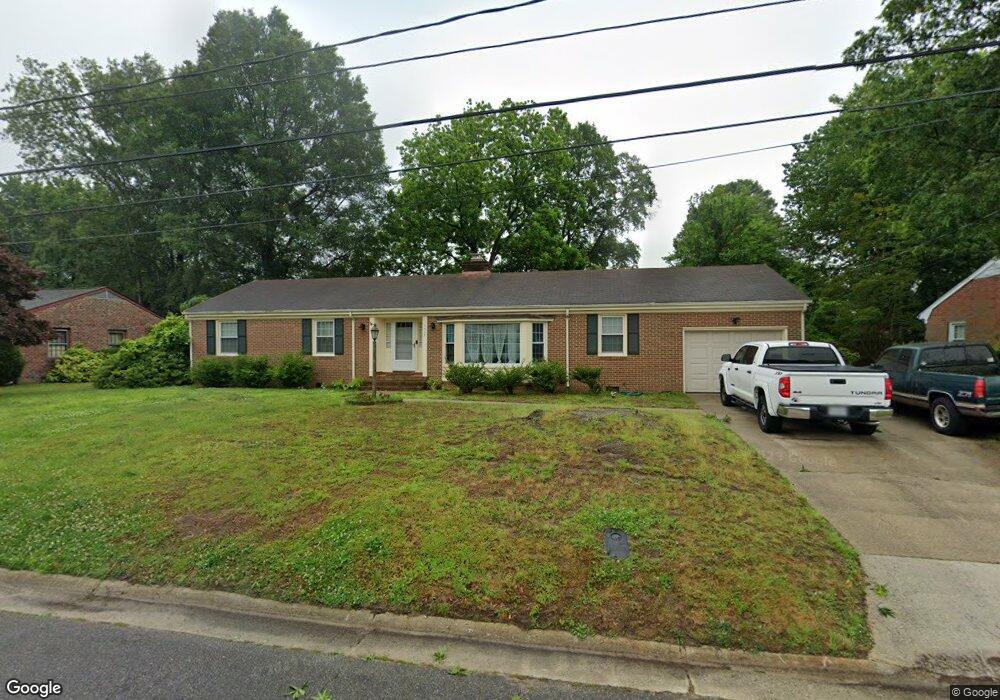
4517 Buckingham Dr Portsmouth, VA 23703
Churchland NeighborhoodEstimated Value: $359,000 - $387,000
3
Beds
2
Baths
1,714
Sq Ft
$215/Sq Ft
Est. Value
About This Home
This home is located at 4517 Buckingham Dr, Portsmouth, VA 23703 and is currently estimated at $368,295, approximately $214 per square foot. 4517 Buckingham Dr is a home located in Portsmouth City with nearby schools including Churchland Elementary School, Churchland Academy Elementary School, and Churchland Middle School.
Ownership History
Date
Name
Owned For
Owner Type
Purchase Details
Closed on
Oct 16, 2013
Sold by
Harris William B
Bought by
Ancheta Steven T
Current Estimated Value
Home Financials for this Owner
Home Financials are based on the most recent Mortgage that was taken out on this home.
Original Mortgage
$196,377
Outstanding Balance
$148,548
Interest Rate
4.75%
Mortgage Type
FHA
Estimated Equity
$219,747
Purchase Details
Closed on
Apr 20, 2004
Sold by
Lehman Mary
Bought by
Harris William
Home Financials for this Owner
Home Financials are based on the most recent Mortgage that was taken out on this home.
Original Mortgage
$162,450
Interest Rate
5.39%
Mortgage Type
New Conventional
Purchase Details
Closed on
Feb 25, 1999
Sold by
Henderson Alvin R
Bought by
Lehman Mary Jane
Home Financials for this Owner
Home Financials are based on the most recent Mortgage that was taken out on this home.
Original Mortgage
$112,100
Interest Rate
6.78%
Create a Home Valuation Report for This Property
The Home Valuation Report is an in-depth analysis detailing your home's value as well as a comparison with similar homes in the area
Home Values in the Area
Average Home Value in this Area
Purchase History
| Date | Buyer | Sale Price | Title Company |
|---|---|---|---|
| Ancheta Steven T | $200,000 | -- | |
| Harris William | $180,500 | -- | |
| Lehman Mary Jane | $118,000 | -- |
Source: Public Records
Mortgage History
| Date | Status | Borrower | Loan Amount |
|---|---|---|---|
| Open | Ancheta Steven T | $196,377 | |
| Previous Owner | Harris William | $162,450 | |
| Previous Owner | Lehman Mary Jane | $112,100 |
Source: Public Records
Tax History Compared to Growth
Tax History
| Year | Tax Paid | Tax Assessment Tax Assessment Total Assessment is a certain percentage of the fair market value that is determined by local assessors to be the total taxable value of land and additions on the property. | Land | Improvement |
|---|---|---|---|---|
| 2025 | $3,952 | $310,550 | $94,160 | $216,390 |
| 2024 | $3,952 | $307,370 | $94,160 | $213,210 |
| 2023 | $3,703 | $296,260 | $94,160 | $202,100 |
| 2022 | $3,420 | $263,100 | $78,470 | $184,630 |
| 2021 | $3,020 | $232,290 | $60,360 | $171,930 |
| 2020 | $2,941 | $226,250 | $57,490 | $168,760 |
| 2019 | $2,838 | $218,310 | $57,490 | $160,820 |
| 2018 | $2,771 | $213,150 | $57,490 | $155,660 |
| 2017 | $2,771 | $213,150 | $57,490 | $155,660 |
| 2016 | $2,751 | $211,580 | $57,490 | $154,090 |
| 2015 | $2,751 | $211,580 | $57,490 | $154,090 |
| 2014 | $2,687 | $211,580 | $57,490 | $154,090 |
Source: Public Records
Map
Nearby Homes
- 4412 Carlton Ct
- 3408 Wakefield Dr
- 4705 Templar Dr
- 4313 Templar Dr
- 3405 Canterbury Dr
- 3108 Whaley Rd
- 3141 Riveredge Dr
- 3613 Cardinal Ln
- 4239 Hatton Point Ln Unit 35
- 3200 Westwood Crescent
- 4286 Hatton Point Ln
- 4257 Hatton Point Ln Unit 44
- 4808 Thornwood St
- 2004 Sawgrass Ln
- 3121 Riveredge Dr
- 3425 Cedar Ln
- 4285 Hatton Point Ln
- 4707 High St W
- 4517 Wake Forest Rd
- 4291 Hatton Point Ln
- 4513 Buckingham Dr
- 4521 Buckingham Dr
- 4516 Regent Dr
- 4516 Buckingham Dr
- 4524 Regent Dr
- 4512 Regent Dr
- 4509 Buckingham Dr
- 4525 Buckingham Dr
- 4520 Buckingham Dr
- 4512 Buckingham Dr
- 4508 Regent Dr
- 4534 Regent Dr
- 4524 Buckingham Dr
- 4508 Buckingham Dr
- 4529 Buckingham Dr
- 4505 Buckingham Dr
- 4517 Glencove Dr
- 4517 Regent Dr
- 4521 Glencove Dr
- 4521 Regent Dr