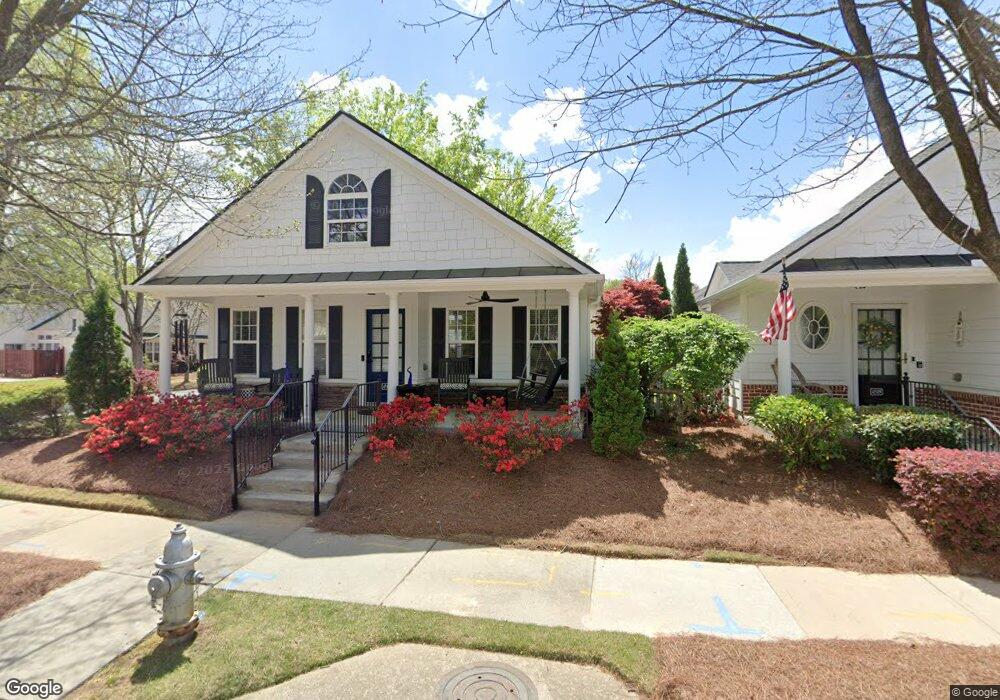
4517 Flowering Branch Unit 10 Powder Springs, GA 30127
Estimated Value: $356,000 - $398,000
3
Beds
2
Baths
1,877
Sq Ft
$200/Sq Ft
Est. Value
About This Home
This home is located at 4517 Flowering Branch Unit 10, Powder Springs, GA 30127 and is currently estimated at $374,548, approximately $199 per square foot. 4517 Flowering Branch Unit 10 is a home located in Cobb County with nearby schools including Powder Springs Elementary School, Cooper Middle School, and McEachern High School.
Ownership History
Date
Name
Owned For
Owner Type
Purchase Details
Closed on
Apr 22, 2025
Sold by
Blalock Kay
Bought by
Kay Blalock Revocable Trust and Blalock
Current Estimated Value
Purchase Details
Closed on
Sep 4, 2024
Sold by
Harrison William Elridge
Bought by
Blalock Kay
Purchase Details
Closed on
Sep 30, 2014
Sold by
Fleenor Annette Diane
Bought by
Harrison William E
Home Financials for this Owner
Home Financials are based on the most recent Mortgage that was taken out on this home.
Original Mortgage
$144,000
Interest Rate
4.17%
Mortgage Type
New Conventional
Purchase Details
Closed on
Jun 1, 2004
Sold by
Leland Homes & Neighborhoods Llc
Bought by
Fleenor Annette D
Home Financials for this Owner
Home Financials are based on the most recent Mortgage that was taken out on this home.
Original Mortgage
$151,050
Interest Rate
3.5%
Mortgage Type
New Conventional
Create a Home Valuation Report for This Property
The Home Valuation Report is an in-depth analysis detailing your home's value as well as a comparison with similar homes in the area
Home Values in the Area
Average Home Value in this Area
Purchase History
| Date | Buyer | Sale Price | Title Company |
|---|---|---|---|
| Kay Blalock Revocable Trust | -- | None Listed On Document | |
| Blalock Kay | $385,000 | None Listed On Document | |
| Harrison William E | $180,000 | -- | |
| Fleenor Annette D | $188,900 | -- |
Source: Public Records
Mortgage History
| Date | Status | Borrower | Loan Amount |
|---|---|---|---|
| Previous Owner | Harrison William E | $144,000 | |
| Previous Owner | Fleenor Annette D | $151,050 |
Source: Public Records
Tax History Compared to Growth
Tax History
| Year | Tax Paid | Tax Assessment Tax Assessment Total Assessment is a certain percentage of the fair market value that is determined by local assessors to be the total taxable value of land and additions on the property. | Land | Improvement |
|---|---|---|---|---|
| 2025 | $1,688 | $155,092 | $26,000 | $129,092 |
| 2024 | $957 | $155,092 | $26,000 | $129,092 |
| 2023 | $714 | $142,960 | $26,000 | $116,960 |
| 2022 | $799 | $102,424 | $20,000 | $82,424 |
| 2021 | $799 | $102,424 | $20,000 | $82,424 |
| 2020 | $769 | $92,252 | $20,000 | $72,252 |
| 2019 | $769 | $92,252 | $20,000 | $72,252 |
| 2018 | $769 | $92,252 | $20,000 | $72,252 |
| 2017 | $624 | $74,356 | $15,600 | $58,756 |
| 2016 | $625 | $74,356 | $15,600 | $58,756 |
| 2015 | $646 | $68,276 | $15,600 | $52,676 |
| 2014 | $653 | $68,276 | $0 | $0 |
Source: Public Records
Map
Nearby Homes
- 3637 Spring Beauty Ct
- 3773 Jack Vernon Cir
- 3747 Gardenwick Rd
- 3794 Jack Vernon Cir
- 3796 Jack Vernon Cir
- 3798 Jack Vernon Cir
- 3420 Sweetbriar Ln
- 3772 Jack Vernon Cir
- 4683 Sweetwater Ave
- 3355 Timber Ridge
- 4810 Hillside Ct
- 4274 Pineview Dr
- 4824 Buckhorn Ct
- 3258 Woodcliff Way
- 3220 Way Unit 24
- 4284 Marietta St
- 3389 Lochness Ln
- 4517 Flowering Branch
- 4519 Flowering Branch
- 0 Lilac Springs Dr Unit 7486027
- 0 Lilac Springs Dr Unit 7394491
- 0 Lilac Springs Dr Unit 7188566
- 0 Lilac Springs Dr Unit 7038048
- 0 Lilac Springs Dr Unit 8697395
- 0 Lilac Springs Dr Unit 8304577
- 0 Lilac Springs Dr Unit 8146049
- 0 Lilac Springs Dr Unit 3168883
- 0 Lilac Springs Dr Unit 3282416
- 0 Lilac Springs Dr
- 4523 Flowering Branch
- 3571 Lilac Springs Dr
- 4513 Flowering Branch
- 3586 Lilac Springs Dr
- 4525 Flowering Branch
- 3573 Lilac Springs Dr
- 3584 Lilac Springs Dr
- 3588 Lilac Springs Dr