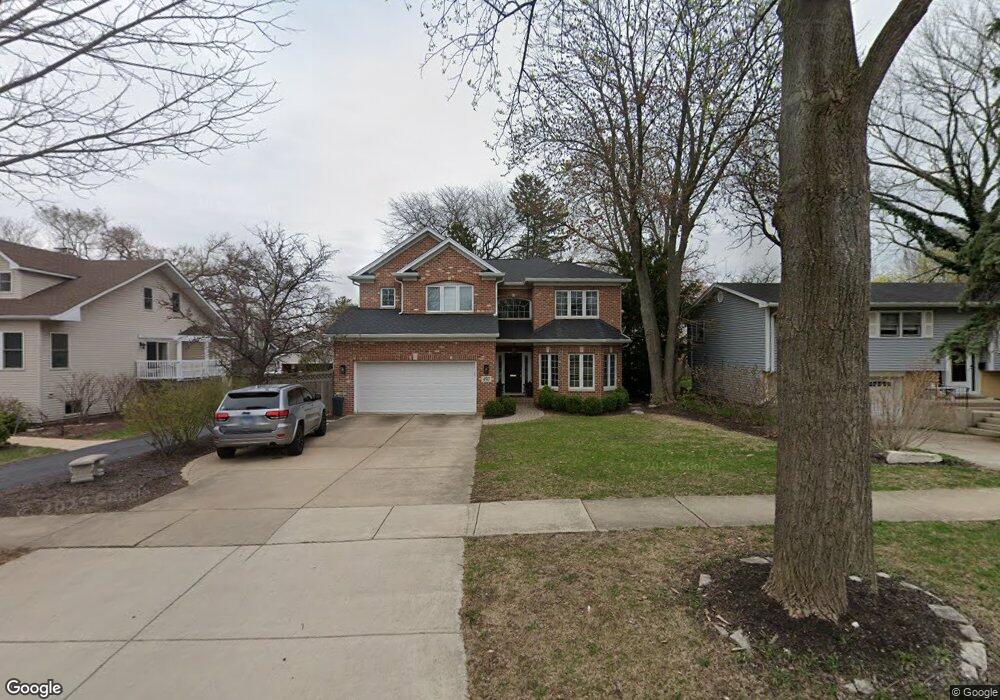
4517 Highland Ave Downers Grove, IL 60515
Estimated Value: $1,053,575 - $1,331,000
--
Bed
1
Bath
2,769
Sq Ft
$414/Sq Ft
Est. Value
About This Home
This home is located at 4517 Highland Ave, Downers Grove, IL 60515 and is currently estimated at $1,147,644, approximately $414 per square foot. 4517 Highland Ave is a home located in DuPage County with nearby schools including Lester Elementary School, Herrick Middle School, and Downer Grove North High School.
Ownership History
Date
Name
Owned For
Owner Type
Purchase Details
Closed on
Oct 12, 2022
Sold by
Wayman Michael E and Wayman Michelle
Bought by
Michelle Wayman Trust
Current Estimated Value
Purchase Details
Closed on
Aug 30, 2002
Sold by
Kull Kevin and Kull Nadia
Bought by
Wayman Michael E and Rouleau Michelle L
Home Financials for this Owner
Home Financials are based on the most recent Mortgage that was taken out on this home.
Original Mortgage
$275,000
Interest Rate
6.54%
Purchase Details
Closed on
Jul 23, 1999
Sold by
Hearthstone Builders Inc
Bought by
Kull Kevin and Kull Nadia
Home Financials for this Owner
Home Financials are based on the most recent Mortgage that was taken out on this home.
Original Mortgage
$238,000
Interest Rate
7.77%
Purchase Details
Closed on
Oct 26, 1998
Sold by
Waszak Robert J
Bought by
Hearthstone Builders Inc
Purchase Details
Closed on
Feb 18, 1998
Sold by
Adams Gail F
Bought by
Waszak Robert J
Create a Home Valuation Report for This Property
The Home Valuation Report is an in-depth analysis detailing your home's value as well as a comparison with similar homes in the area
Home Values in the Area
Average Home Value in this Area
Purchase History
| Date | Buyer | Sale Price | Title Company |
|---|---|---|---|
| Michelle Wayman Trust | -- | -- | |
| Wayman Michael E | $550,000 | First American Title | |
| Kull Kevin | $410,500 | First American Title Ins | |
| Hearthstone Builders Inc | -- | -- | |
| Waszak Robert J | $115,000 | Chicago Title Insurance Co |
Source: Public Records
Mortgage History
| Date | Status | Borrower | Loan Amount |
|---|---|---|---|
| Previous Owner | Wayman Michael E | $275,000 | |
| Previous Owner | Kull Kevin | $238,000 |
Source: Public Records
Tax History Compared to Growth
Tax History
| Year | Tax Paid | Tax Assessment Tax Assessment Total Assessment is a certain percentage of the fair market value that is determined by local assessors to be the total taxable value of land and additions on the property. | Land | Improvement |
|---|---|---|---|---|
| 2024 | $16,003 | $287,527 | $70,979 | $216,548 |
| 2023 | $15,236 | $264,320 | $65,250 | $199,070 |
| 2022 | $14,377 | $250,280 | $61,780 | $188,500 |
| 2021 | $13,460 | $247,440 | $61,080 | $186,360 |
| 2020 | $13,215 | $242,540 | $59,870 | $182,670 |
| 2019 | $12,804 | $232,720 | $57,450 | $175,270 |
| 2018 | $12,465 | $224,090 | $57,110 | $166,980 |
| 2017 | $12,078 | $215,640 | $54,960 | $160,680 |
| 2016 | $11,849 | $205,800 | $52,450 | $153,350 |
| 2015 | $11,735 | $193,620 | $49,350 | $144,270 |
| 2014 | $11,467 | $183,890 | $43,620 | $140,270 |
| 2013 | $11,235 | $183,030 | $43,420 | $139,610 |
Source: Public Records
Map
Nearby Homes
- 4533 Highland Ave
- 727 Grant St
- 4512 Saratoga Ave
- 4731 Saratoga Ave
- 4225 Highland Ave
- 4217 Main St
- 1219 Ogden Ave
- 4532 Sherwood Ave
- 624 Prairie Ave
- 4900 Forest Ave Unit 108
- 4900 Forest Ave Unit 201
- 4900 Forest Ave Unit 308
- 4900 Forest Ave Unit 204
- 4900 Forest Ave Unit 205
- 4133 Lindley St
- 541 Chicago Ave
- 4829 Linscott Ave
- 536 Prairie Ave
- 505 Lincoln Ave
- 841 Rogers St
- 4513 Highland Ave
- 4521 Highland Ave
- 4509 Highland Ave
- 4525 Highland Ave
- 4516 Bryan Place
- 4512 Bryan Place
- 4520 Bryan Place
- 4505 Highland Ave
- 4508 Bryan Place
- 4520 Highland Ave
- 4524 Bryan Place
- 4529 Highland Ave
- 4504 Bryan Place
- 933 Grant St
- 4524 Highland Ave
- 4528 Bryan Place
- 4500 Bryan Place
- 4528 Highland Ave
- 4532 Highland Ave
- 4532 Bryan Place