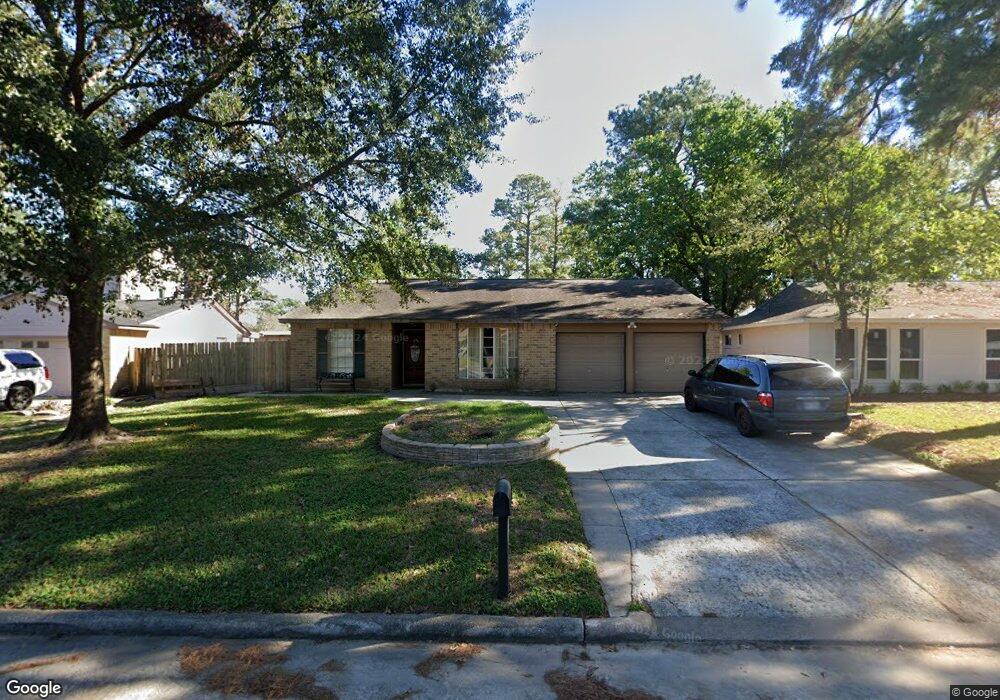
4518 Burkegate Dr Spring, TX 77373
Estimated Value: $204,545 - $218,000
3
Beds
2
Baths
1,659
Sq Ft
$127/Sq Ft
Est. Value
About This Home
This home is located at 4518 Burkegate Dr, Spring, TX 77373 and is currently estimated at $211,386, approximately $127 per square foot. 4518 Burkegate Dr is a home located in Harris County with nearby schools including Mildred Jenkins Elementary School, Dueitt Middle School, and Spring High School.
Ownership History
Date
Name
Owned For
Owner Type
Purchase Details
Closed on
Jan 30, 2015
Sold by
Cradit Mark Edwin and Cradit Jennifer Lynnette
Bought by
Jpmorgan Chase Bank Na
Current Estimated Value
Home Financials for this Owner
Home Financials are based on the most recent Mortgage that was taken out on this home.
Original Mortgage
$85,424
Outstanding Balance
$67,733
Interest Rate
4.75%
Mortgage Type
FHA
Estimated Equity
$143,653
Purchase Details
Closed on
May 27, 1994
Sold by
Spenella Charles J and Spenella Deborah Brown
Bought by
Cradit Mark Edwin and Cradit Jennifer Lynnette
Home Financials for this Owner
Home Financials are based on the most recent Mortgage that was taken out on this home.
Original Mortgage
$46,400
Interest Rate
8.45%
Mortgage Type
Seller Take Back
Create a Home Valuation Report for This Property
The Home Valuation Report is an in-depth analysis detailing your home's value as well as a comparison with similar homes in the area
Home Values in the Area
Average Home Value in this Area
Purchase History
| Date | Buyer | Sale Price | Title Company |
|---|---|---|---|
| Jpmorgan Chase Bank Na | -- | Chicago Title | |
| Cradit Mark Edwin | -- | Title Agency #77 |
Source: Public Records
Mortgage History
| Date | Status | Borrower | Loan Amount |
|---|---|---|---|
| Open | Jpmorgan Chase Bank Na | $85,424 | |
| Previous Owner | Cradit Mark Edwin | $46,400 |
Source: Public Records
Tax History
| Year | Tax Paid | Tax Assessment Tax Assessment Total Assessment is a certain percentage of the fair market value that is determined by local assessors to be the total taxable value of land and additions on the property. | Land | Improvement |
|---|---|---|---|---|
| 2025 | $761 | $215,592 | $37,674 | $177,918 |
| 2024 | $761 | $213,576 | $37,674 | $175,902 |
| 2023 | $761 | $218,736 | $37,674 | $181,062 |
| 2022 | $3,471 | $199,670 | $37,674 | $161,996 |
| 2021 | $3,343 | $156,530 | $21,294 | $135,236 |
| 2020 | $3,245 | $151,621 | $21,294 | $130,327 |
| 2019 | $3,057 | $139,741 | $21,294 | $118,447 |
| 2018 | $511 | $136,615 | $21,294 | $115,321 |
| 2017 | $2,499 | $136,615 | $21,294 | $115,321 |
| 2016 | $2,271 | $101,845 | $14,742 | $87,103 |
| 2015 | $1,592 | $91,773 | $14,742 | $77,031 |
| 2014 | $1,592 | $79,863 | $14,742 | $65,121 |
Source: Public Records
Map
Nearby Homes
- 4538 Burkegate Dr
- 4515 Mossygate Dr
- 23430 Wintergate Dr
- 4423 Mossygate Dr
- 4519 Tylergate Dr
- 23815 Firegate Dr
- 4318 Burkegate Dr
- 4610 Sloangate Dr
- 4311 Enchantedgate Dr
- 4527 Adonis Dr
- 4522 Cannongate Dr
- 4831 Blue Jacaranda Way
- 4303 Chestergate Dr
- 4307 Sloangate Dr
- 4542 Algernon Dr
- 4330 Tylergate Dr
- 23915 Floragate Dr
- 4919 Hickorygate Dr
- 23663 Rainbow Eucalyptus Dr
- 24022 Rockygate Dr
- 4514 Burkegate Dr
- 4522 Burkegate Dr
- 4510 Burkegate Dr
- 4523 Enchantedgate Dr
- 4531 Enchantedgate Dr
- 4526 Burkegate Dr
- 4519 Enchantedgate Dr
- 4535 Enchantedgate Dr
- 4519 Burkegate Dr
- 4506 Burkegate Dr
- 4523 Burkegate Dr
- 4515 Burkegate Dr
- 4530 Burkegate Dr
- 4515 Enchantedgate Dr
- 4527 Burkegate Dr
- 4539 Enchantedgate Dr
- 4511 Burkegate Dr
- 4502 Burkegate Dr
- 4534 Burkegate Dr
- 4531 Burkegate Dr
Your Personal Tour Guide
Ask me questions while you tour the home.