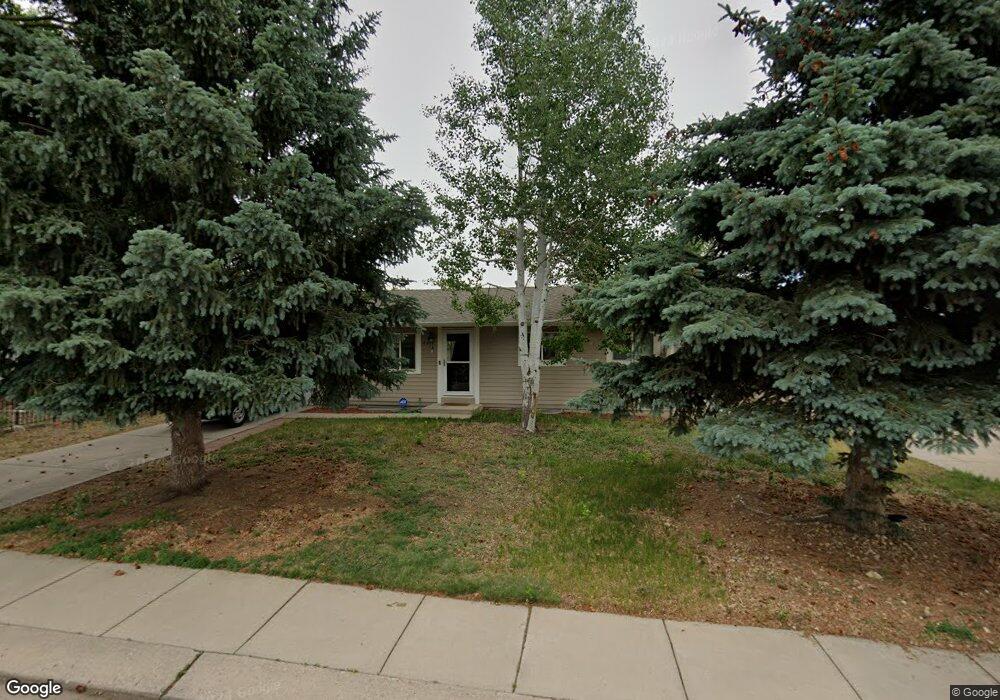
4518 Hopeful Way Colorado Springs, CO 80917
Village Seven NeighborhoodEstimated Value: $352,286 - $391,000
3
Beds
1
Bath
936
Sq Ft
$399/Sq Ft
Est. Value
About This Home
This home is located at 4518 Hopeful Way, Colorado Springs, CO 80917 and is currently estimated at $373,822, approximately $399 per square foot. 4518 Hopeful Way is a home located in El Paso County with nearby schools including Carver Elementary School, Sabin Middle School, and Doherty High School.
Ownership History
Date
Name
Owned For
Owner Type
Purchase Details
Closed on
May 9, 2019
Sold by
Steen Karla R and Steen John
Bought by
Rafalski Ryan L and Rafalski Sarah E
Current Estimated Value
Home Financials for this Owner
Home Financials are based on the most recent Mortgage that was taken out on this home.
Original Mortgage
$237,650
Outstanding Balance
$208,089
Interest Rate
4%
Mortgage Type
New Conventional
Estimated Equity
$165,733
Purchase Details
Closed on
Oct 12, 2006
Sold by
Necaise William Clay
Bought by
Steen Karla R and Steen John
Home Financials for this Owner
Home Financials are based on the most recent Mortgage that was taken out on this home.
Original Mortgage
$150,100
Interest Rate
6.46%
Mortgage Type
Unknown
Purchase Details
Closed on
Jan 20, 2006
Sold by
Ramsey Rex A and Ramsey Kimberly K
Bought by
Necaise William Clay
Purchase Details
Closed on
Jun 30, 1989
Bought by
Steen Karla R
Purchase Details
Closed on
Sep 1, 1980
Bought by
Steen Karla R
Create a Home Valuation Report for This Property
The Home Valuation Report is an in-depth analysis detailing your home's value as well as a comparison with similar homes in the area
Home Values in the Area
Average Home Value in this Area
Purchase History
| Date | Buyer | Sale Price | Title Company |
|---|---|---|---|
| Rafalski Ryan L | $245,000 | Empire Title Co Springs Llc | |
| Steen Karla R | $158,000 | Stewart Title Of Co Inc | |
| Necaise William Clay | $127,000 | Stewart Title | |
| Steen Karla R | -- | -- | |
| Steen Karla R | -- | -- |
Source: Public Records
Mortgage History
| Date | Status | Borrower | Loan Amount |
|---|---|---|---|
| Open | Rafalski Ryan L | $237,650 | |
| Previous Owner | Steen Karla R | $150,100 |
Source: Public Records
Tax History Compared to Growth
Tax History
| Year | Tax Paid | Tax Assessment Tax Assessment Total Assessment is a certain percentage of the fair market value that is determined by local assessors to be the total taxable value of land and additions on the property. | Land | Improvement |
|---|---|---|---|---|
| 2025 | $1,157 | $24,990 | -- | -- |
| 2024 | $1,046 | $25,220 | $4,400 | $20,820 |
| 2023 | $1,046 | $25,220 | $4,400 | $20,820 |
| 2022 | $911 | $16,280 | $3,340 | $12,940 |
| 2021 | $988 | $16,740 | $3,430 | $13,310 |
| 2020 | $842 | $12,410 | $2,970 | $9,440 |
| 2019 | $838 | $12,410 | $2,970 | $9,440 |
| 2018 | $773 | $10,530 | $2,590 | $7,940 |
| 2017 | $732 | $10,530 | $2,590 | $7,940 |
| 2016 | $551 | $9,500 | $2,170 | $7,330 |
| 2015 | $549 | $9,500 | $2,170 | $7,330 |
| 2014 | $515 | $8,560 | $2,170 | $6,390 |
Source: Public Records
Map
Nearby Homes
- 4318 Hopeful Way
- 4350 Siferd Blvd
- 4266 Orchid St
- 4090 Hopeful Dr
- 4685 Barnes Rd
- 4501 Winewood Village Dr Unit K4501
- 4135 Neat Place
- 4649 N Crimson Cir
- 4139 Park Haven View
- 4242 Amiable Way
- 4127 Park Haven View
- 4127 Park Haven
- 4534 Winewood Village Dr Unit P4534
- 4768 S Gracemoor Cir
- 4710 Cheerful Rd
- 4344 S Delighted Cir
- 4671 Winewood Village Dr Unit X4671
- 4255 Hedge Ln
- 4735 Iron Horse Villas Point
- 4005 Siferd Blvd
- 4512 Hopeful Way
- 4524 Hopeful Way
- 4506 Hopeful Way
- 4530 Hopeful Way
- 4437 Hopeful Way
- 4531 Hopeful Way
- 4448 Hopeful Way
- 4431 Hopeful Way
- 4536 Hopeful Way
- 4537 Hopeful Way
- 4442 Hopeful Way
- 4436 Hopeful Way
- 4425 Hopeful Way
- 4542 Hopeful Way
- 4430 Hopeful Way
- 4548 Hopeful Way
- 4424 Hopeful Way
- 4331 Hopeful Way
- 4554 Hopeful Way
- 4315 Hopeful Dr