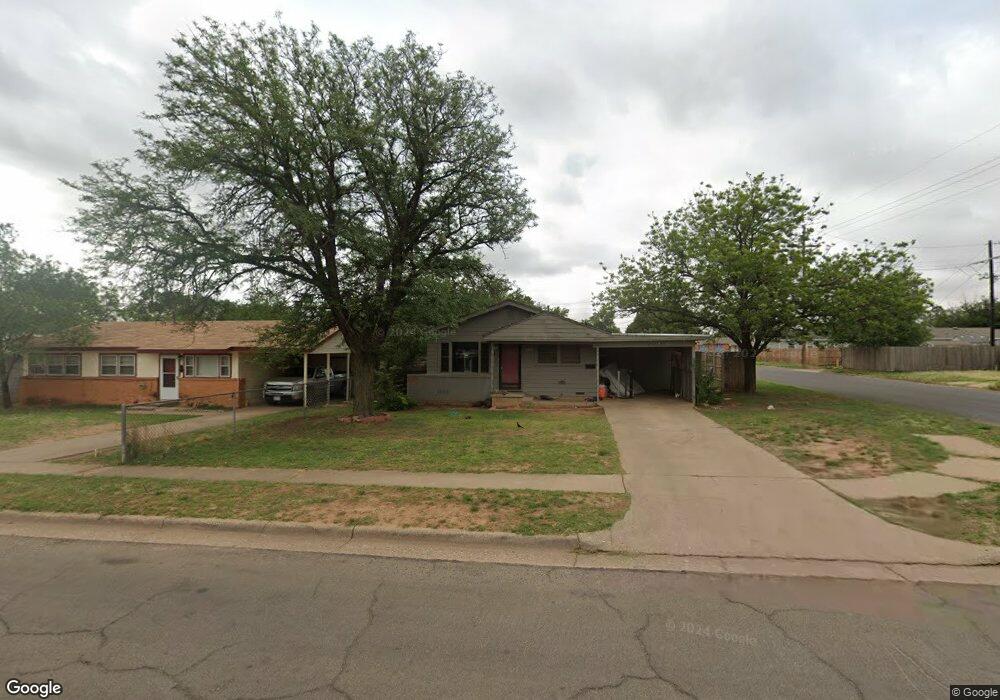
4519 43rd St Lubbock, TX 79414
Stubbs-Stewart NeighborhoodEstimated Value: $92,000 - $111,000
3
Beds
1
Bath
912
Sq Ft
$112/Sq Ft
Est. Value
About This Home
This home is located at 4519 43rd St, Lubbock, TX 79414 and is currently estimated at $101,896, approximately $111 per square foot. 4519 43rd St is a home located in Lubbock County with nearby schools including Stewart Elementary School, Irons Middle School, and Coronado High School.
Ownership History
Date
Name
Owned For
Owner Type
Purchase Details
Closed on
Mar 8, 2023
Sold by
Mccauley R Michael
Bought by
Needham Properties Inc
Current Estimated Value
Purchase Details
Closed on
Feb 4, 2021
Sold by
Needham Properties Inc
Bought by
Villanueva Alejandro and Salazar Elexis
Home Financials for this Owner
Home Financials are based on the most recent Mortgage that was taken out on this home.
Original Mortgage
$73,000
Interest Rate
2.1%
Mortgage Type
Purchase Money Mortgage
Purchase Details
Closed on
Feb 28, 2002
Sold by
Bramlett Karen E
Bought by
Needham Properties Inc
Purchase Details
Closed on
Jul 11, 1997
Sold by
Brooks Lesley J
Bought by
Needham Properties Inc
Purchase Details
Closed on
Jan 27, 1993
Bought by
Needham Properties Inc
Create a Home Valuation Report for This Property
The Home Valuation Report is an in-depth analysis detailing your home's value as well as a comparison with similar homes in the area
Home Values in the Area
Average Home Value in this Area
Purchase History
| Date | Buyer | Sale Price | Title Company |
|---|---|---|---|
| Needham Properties Inc | $77,092 | -- | |
| Villanueva Alejandro | -- | Hub City Title | |
| Needham Properties Inc | -- | -- | |
| Needham Properties Inc | -- | -- | |
| Needham Properties Inc | -- | -- |
Source: Public Records
Mortgage History
| Date | Status | Borrower | Loan Amount |
|---|---|---|---|
| Previous Owner | Villanueva Alejandro | $73,000 |
Source: Public Records
Tax History
| Year | Tax Paid | Tax Assessment Tax Assessment Total Assessment is a certain percentage of the fair market value that is determined by local assessors to be the total taxable value of land and additions on the property. | Land | Improvement |
|---|---|---|---|---|
| 2025 | $1,289 | $71,000 | $20,000 | $51,000 |
| 2024 | $17 | $91,908 | $20,000 | $71,908 |
| 2023 | $1,734 | $93,307 | $7,620 | $85,687 |
| 2022 | $1,837 | $90,724 | $7,620 | $83,104 |
| 2021 | $1,664 | $77,689 | $7,620 | $70,069 |
| 2020 | $1,306 | $60,073 | $7,620 | $52,453 |
| 2019 | $1,349 | $60,073 | $7,620 | $52,453 |
| 2018 | $1,271 | $56,551 | $7,620 | $48,931 |
| 2017 | $1,202 | $53,418 | $7,620 | $45,798 |
| 2016 | $1,202 | $53,418 | $7,620 | $45,798 |
| 2015 | $1,215 | $55,249 | $7,620 | $47,629 |
| 2014 | $1,215 | $54,642 | $3,900 | $50,742 |
Source: Public Records
Map
Nearby Homes
Your Personal Tour Guide
Ask me questions while you tour the home.