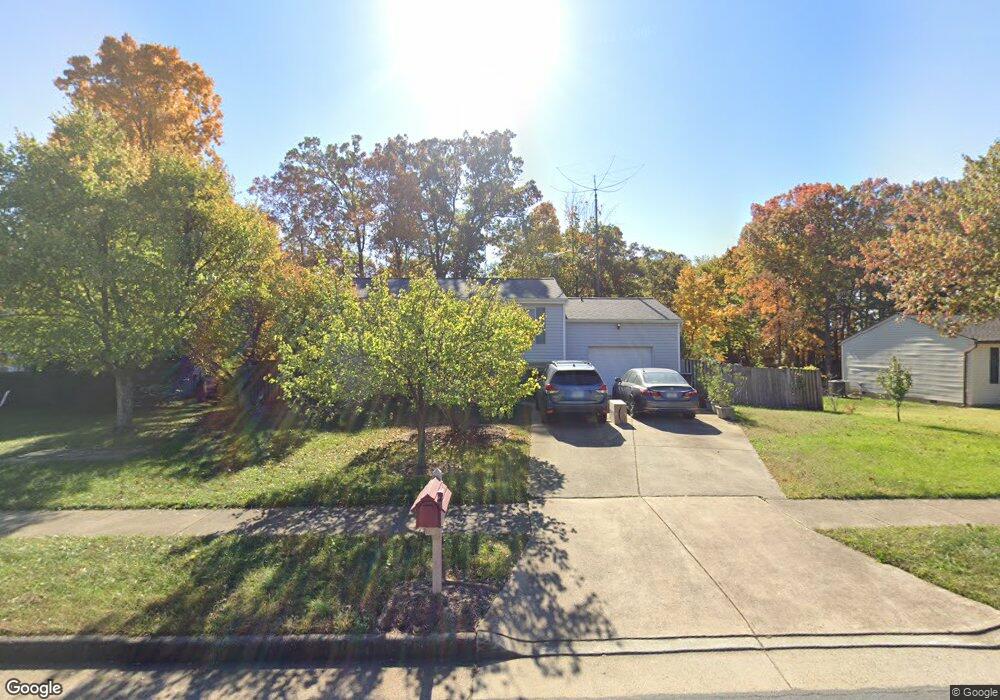
4519 Cub Run Rd Chantilly, VA 20151
Estimated Value: $606,801 - $635,000
4
Beds
2
Baths
826
Sq Ft
$749/Sq Ft
Est. Value
About This Home
This home is located at 4519 Cub Run Rd, Chantilly, VA 20151 and is currently estimated at $618,700, approximately $749 per square foot. 4519 Cub Run Rd is a home located in Fairfax County with nearby schools including Virginia Run Elementary School, Ormond Stone Middle School, and Westfield High School.
Ownership History
Date
Name
Owned For
Owner Type
Purchase Details
Closed on
Dec 22, 2006
Sold by
Rogers Kendall Lee
Bought by
Sufitchi Ciprian
Current Estimated Value
Home Financials for this Owner
Home Financials are based on the most recent Mortgage that was taken out on this home.
Original Mortgage
$328,000
Outstanding Balance
$195,887
Interest Rate
6.29%
Mortgage Type
New Conventional
Estimated Equity
$422,813
Purchase Details
Closed on
Jun 30, 2003
Sold by
Bustle Wayne T
Bought by
Rogers Kendall Lee
Home Financials for this Owner
Home Financials are based on the most recent Mortgage that was taken out on this home.
Original Mortgage
$234,000
Interest Rate
5.53%
Mortgage Type
New Conventional
Purchase Details
Closed on
Oct 25, 1994
Sold by
Darling Neil A
Bought by
Bustle Wayne T
Home Financials for this Owner
Home Financials are based on the most recent Mortgage that was taken out on this home.
Original Mortgage
$134,900
Interest Rate
8.49%
Create a Home Valuation Report for This Property
The Home Valuation Report is an in-depth analysis detailing your home's value as well as a comparison with similar homes in the area
Home Values in the Area
Average Home Value in this Area
Purchase History
| Date | Buyer | Sale Price | Title Company |
|---|---|---|---|
| Sufitchi Ciprian | $410,000 | -- | |
| Rogers Kendall Lee | $292,000 | -- | |
| Bustle Wayne T | $149,900 | -- |
Source: Public Records
Mortgage History
| Date | Status | Borrower | Loan Amount |
|---|---|---|---|
| Open | Sufitchi Ciprian | $328,000 | |
| Previous Owner | Bustle Wayne T | $234,000 | |
| Previous Owner | Bustle Wayne T | $134,900 |
Source: Public Records
Tax History
| Year | Tax Paid | Tax Assessment Tax Assessment Total Assessment is a certain percentage of the fair market value that is determined by local assessors to be the total taxable value of land and additions on the property. | Land | Improvement |
|---|---|---|---|---|
| 2025 | $6,552 | $571,530 | $240,000 | $331,530 |
| 2024 | $6,552 | $565,550 | $240,000 | $325,550 |
| 2023 | $6,148 | $544,830 | $240,000 | $304,830 |
| 2022 | $5,658 | $494,780 | $230,000 | $264,780 |
| 2021 | $4,960 | $422,650 | $200,000 | $222,650 |
| 2020 | $4,808 | $406,210 | $190,000 | $216,210 |
| 2019 | $4,505 | $380,650 | $185,000 | $195,650 |
| 2018 | $4,295 | $373,510 | $179,000 | $194,510 |
| 2017 | $4,124 | $355,250 | $170,000 | $185,250 |
| 2016 | $4,116 | $355,250 | $170,000 | $185,250 |
Source: Public Records
Map
Nearby Homes
- 4346 Silas Hutchinson Dr
- 4615 Fairfax Manor Ct
- 4616 Fairfax Manor Ct
- 4622 Fairfax Manor Ct
- 0 Fairfax Manor Ct Unit VAFX2160912
- 4610 Fairfax Manor Ct
- 4621 Fairfax Manor Ct
- 26005 Hartwood Dr
- 26073 Nimbleton Square
- 44077 Peirosa Terrace Unit 359
- 44071 Eastgate View Dr
- 25548 Casale Terrace
- 43553 Dempsey Ln
- 14938 Deco Cir
- 14930 Deco Cir
- 14926 Deco Cir
- 14731 National Dr
- 14951 Deco Cir
- 4252 Airline Pkwy
- 14913 Deco Cir
- 4521 Cub Run Rd
- 4517 Cub Run Rd
- 4600 Norris Ct
- 4601 Norris Ct
- 4515 Cub Run Rd
- 4523 Cub Run Rd
- 4516 Cub Run Rd
- 4520 Cub Run Rd
- 4525 Cub Run Rd
- 4602 Norris Ct
- 4603 Norris Ct
- 4513 Cub Run Rd
- 4514 Cub Run Rd
- 15253 Louis Mill Dr
- 15252 Louis Mill Dr
- 4527 Cub Run Rd
- 4529 Cub Run Rd
- 4511 Cub Run Rd
- 4512 Cub Run Rd
- 4605 Norris Ct