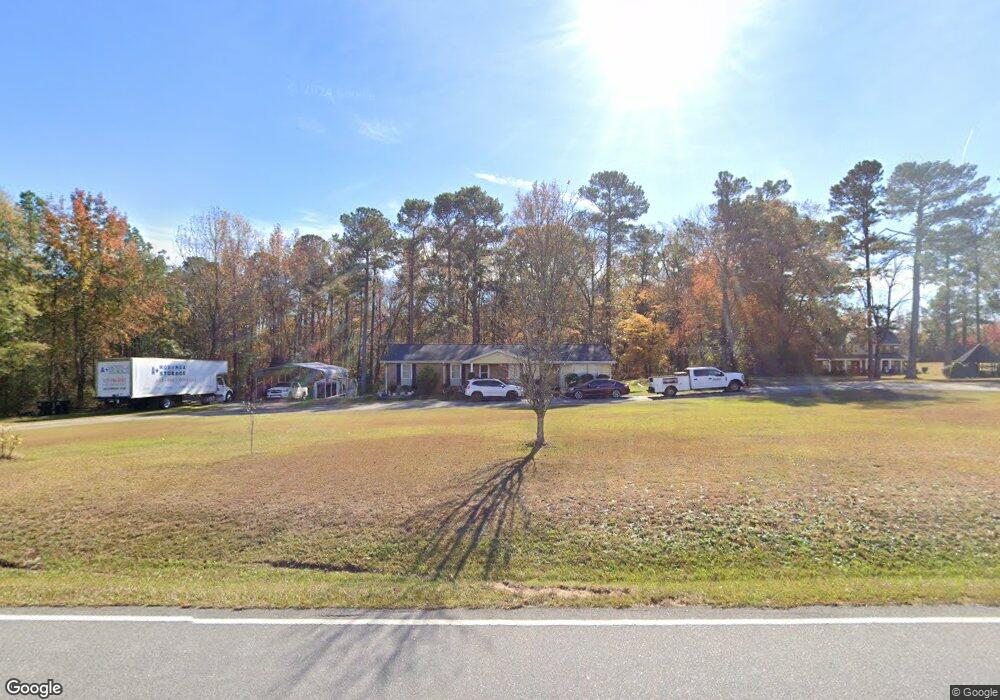
452 Covered Bridge Rd Clayton, NC 27520
Municipal Park NeighborhoodEstimated Value: $331,138 - $390,000
3
Beds
2
Baths
1,852
Sq Ft
$194/Sq Ft
Est. Value
About This Home
This home is located at 452 Covered Bridge Rd, Clayton, NC 27520 and is currently estimated at $359,285, approximately $193 per square foot. 452 Covered Bridge Rd is a home located in Johnston County with nearby schools including Cooper Academy, Riverwood Middle School, and Clayton High.
Ownership History
Date
Name
Owned For
Owner Type
Purchase Details
Closed on
Mar 24, 2017
Sold by
Upchurch Timothy Wayne and Upchurch Lou Ann
Bought by
Martinez Alfonso Sanchez and Garcia Ahida Rodrigues
Current Estimated Value
Home Financials for this Owner
Home Financials are based on the most recent Mortgage that was taken out on this home.
Original Mortgage
$176,739
Outstanding Balance
$146,561
Interest Rate
4.17%
Mortgage Type
FHA
Estimated Equity
$212,724
Purchase Details
Closed on
Nov 16, 2016
Sold by
Barlow James Bruce and Barlow Brenna Elizabeth
Bought by
Upchurch Timothy Wayne and Upchurch Lou Ann
Home Financials for this Owner
Home Financials are based on the most recent Mortgage that was taken out on this home.
Original Mortgage
$91,200
Interest Rate
3.42%
Mortgage Type
New Conventional
Purchase Details
Closed on
Feb 11, 2014
Sold by
Deans Susan Winters
Bought by
Barlow James Bruce and Barlow Brenna Elizabeth
Create a Home Valuation Report for This Property
The Home Valuation Report is an in-depth analysis detailing your home's value as well as a comparison with similar homes in the area
Home Values in the Area
Average Home Value in this Area
Purchase History
| Date | Buyer | Sale Price | Title Company |
|---|---|---|---|
| Martinez Alfonso Sanchez | $180,000 | -- | |
| Upchurch Timothy Wayne | $114,000 | None Available | |
| Barlow James Bruce | -- | None Available |
Source: Public Records
Mortgage History
| Date | Status | Borrower | Loan Amount |
|---|---|---|---|
| Open | Martinez Alfonso Sanchez | $176,739 | |
| Previous Owner | Upchurch Timothy Wayne | $91,200 |
Source: Public Records
Tax History Compared to Growth
Tax History
| Year | Tax Paid | Tax Assessment Tax Assessment Total Assessment is a certain percentage of the fair market value that is determined by local assessors to be the total taxable value of land and additions on the property. | Land | Improvement |
|---|---|---|---|---|
| 2025 | $1,808 | $284,680 | $55,130 | $229,550 |
| 2024 | $1,435 | $177,110 | $35,700 | $141,410 |
| 2023 | $1,488 | $177,110 | $35,700 | $141,410 |
| 2022 | $1,501 | $177,110 | $35,700 | $141,410 |
| 2021 | $1,501 | $177,110 | $35,700 | $141,410 |
| 2020 | $1,554 | $177,110 | $35,700 | $141,410 |
| 2019 | $1,554 | $177,110 | $35,700 | $141,410 |
| 2018 | $1,255 | $139,820 | $28,350 | $111,470 |
| 2017 | $1,041 | $116,020 | $28,350 | $87,670 |
| 2016 | $1,018 | $116,020 | $28,350 | $87,670 |
| 2015 | $1,018 | $116,020 | $28,350 | $87,670 |
| 2014 | $1,018 | $116,020 | $28,350 | $87,670 |
Source: Public Records
Map
Nearby Homes
- 34 Windflower Ct Unit Homesite 7
- 20 Windflower Ct Unit Homesite 5
- 350 Hopper Cir
- 387 Streamliner Blvd
- 48 Railcar Way Unit Homesite 2
- 696 Crestdale Dr
- The Holly Plan at Highgate
- The Concerto Plan at Highgate
- The Hickory Plan at Highgate
- The Maple Plan at Highgate
- 36 Railcar Way
- 36 Railcar Way Unit Homesite 1
- 27 Windflower Ct
- 35 Windflower Ct
- 21 Windflower Ct
- 528 Ballast Point
- 42 Channel Drop Dr
- Alpine Plan at Carolina Overlook by Del Webb - The Passport Series
- Cranbrook Plan at Carolina Overlook by Del Webb - The Villa Series
- Contour Plan at Carolina Overlook by Del Webb - The Passport Series
- 408 Covered Bridge Rd
- 408 Covered Bridge Rd
- 26 Windflower Ct
- 260 Crestdale Dr Unit 6
- 244 Crestdale Dr
- 244 Crestdale Dr Unit 5
- 244 Crestdale Dr Unit 5
- 20 Windflower Ct
- 43 Windflower Ct
- 296 Crestdale Dr
- 363 Covered Bridge Rd
- 669 Crestdale Dr
- 672 Crestdale Dr
- 660 Crestdale Dr Unit 161
- 629 Crestdale Dr Unit 154
- 639 Crestdale Dr
- 689 Crestdale Dr
- 672 Crestdale Dr Unit 160
- 682 Crestdale Dr Unit 159
- 638 Crestdale Dr Unit 163