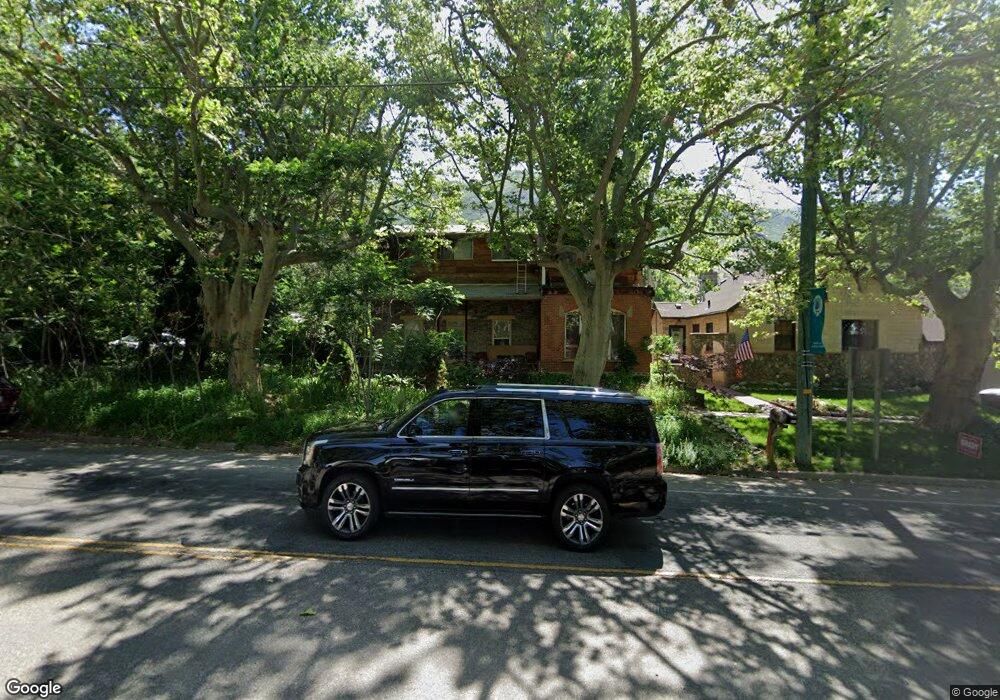
452 N Main St Farmington, UT 84025
Estimated Value: $544,000 - $942,000
3
Beds
2
Baths
2,973
Sq Ft
$236/Sq Ft
Est. Value
About This Home
This home is located at 452 N Main St, Farmington, UT 84025 and is currently estimated at $702,410, approximately $236 per square foot. 452 N Main St is a home located in Davis County with nearby schools including Farmington Elementary School, Farmington High, and Farmington Junior High School.
Ownership History
Date
Name
Owned For
Owner Type
Purchase Details
Closed on
May 10, 2013
Sold by
Tarchin Andrew and Tarchin Jen Shurtliff
Bought by
Tarchin Andrew and Tarchin Jen
Current Estimated Value
Home Financials for this Owner
Home Financials are based on the most recent Mortgage that was taken out on this home.
Original Mortgage
$192,000
Outstanding Balance
$136,419
Interest Rate
3.54%
Mortgage Type
New Conventional
Estimated Equity
$565,991
Purchase Details
Closed on
May 3, 2013
Sold by
Tarchin Jen Shurtlif and Tarchin Andrew
Bought by
Tarchin Andrew and Tarchin Jen Shurtlif
Home Financials for this Owner
Home Financials are based on the most recent Mortgage that was taken out on this home.
Original Mortgage
$192,000
Outstanding Balance
$136,419
Interest Rate
3.54%
Mortgage Type
New Conventional
Estimated Equity
$565,991
Purchase Details
Closed on
Sep 16, 2004
Sold by
Shurtliff Jen
Bought by
Tarchin Andrew and Tarchin Jen Shurtliff
Home Financials for this Owner
Home Financials are based on the most recent Mortgage that was taken out on this home.
Original Mortgage
$40,000
Interest Rate
5.94%
Mortgage Type
New Conventional
Purchase Details
Closed on
Jan 27, 2001
Sold by
Hamblin Lyman D
Bought by
Shurtliff Jen
Create a Home Valuation Report for This Property
The Home Valuation Report is an in-depth analysis detailing your home's value as well as a comparison with similar homes in the area
Home Values in the Area
Average Home Value in this Area
Purchase History
| Date | Buyer | Sale Price | Title Company |
|---|---|---|---|
| Tarchin Andrew | -- | Inwest Title Services Inc | |
| Tarchin Andrew | -- | Inwest Title Services Inc | |
| Tarchin Andrew | -- | -- | |
| Shurtliff Jen | -- | -- |
Source: Public Records
Mortgage History
| Date | Status | Borrower | Loan Amount |
|---|---|---|---|
| Open | Tarchin Andrew | $192,000 | |
| Closed | Tarchin Andrew | $40,000 |
Source: Public Records
Tax History Compared to Growth
Tax History
| Year | Tax Paid | Tax Assessment Tax Assessment Total Assessment is a certain percentage of the fair market value that is determined by local assessors to be the total taxable value of land and additions on the property. | Land | Improvement |
|---|---|---|---|---|
| 2024 | -- | $255,200 | $193,014 | $62,186 |
| 2023 | -- | $442,000 | $332,550 | $109,450 |
| 2022 | $1,895 | $253,000 | $181,955 | $71,045 |
| 2021 | $1,895 | $364,000 | $287,120 | $76,880 |
| 2020 | $1,895 | $322,000 | $247,891 | $74,109 |
| 2019 | $1,895 | $311,000 | $224,831 | $86,169 |
| 2018 | $0 | $286,000 | $219,675 | $66,325 |
| 2016 | $1,743 | $128,810 | $95,180 | $33,630 |
| 2015 | $1,677 | $117,590 | $95,180 | $22,410 |
| 2014 | $1,794 | $129,261 | $79,317 | $49,944 |
| 2013 | $2,000 | $135,672 | $62,807 | $72,865 |
Source: Public Records
Map
Nearby Homes
- 69 W Grove Creek Cir
- 1460 W 550 N Unit 166
- 139 E 400 N
- 170 N Main St
- 2 Grayson Way N Unit 11
- 1504 W Kiera Court Ct N Unit 150
- 292 N Flag Rock Dr
- 21 N 100 W Unit 3
- 1941 W 950 N Unit 1
- 1886 W 950 N Unit 3
- 52 N 400 W
- 901 N Compton Rd
- 79 S 300 E
- 38 S 300 W
- 397 W 850 N
- 334 E Cottrell Ln
- 372 W Clark Cir
- 849 N Evelyn St
- 13 Sunset Dr
- 154 W 1100 N