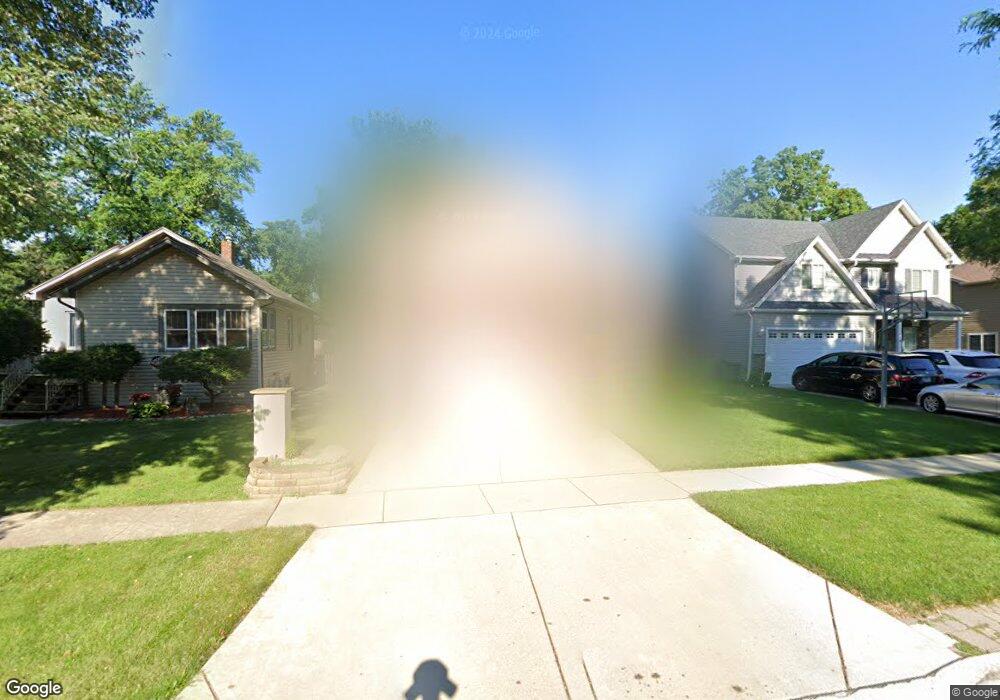
452 S Harvard Ave Villa Park, IL 60181
Estimated Value: $637,983 - $914,000
4
Beds
3
Baths
2,599
Sq Ft
$294/Sq Ft
Est. Value
About This Home
This home is located at 452 S Harvard Ave, Villa Park, IL 60181 and is currently estimated at $764,246, approximately $294 per square foot. 452 S Harvard Ave is a home located in DuPage County with nearby schools including Ardmore Elementary School, Jackson Middle School, and Willowbrook High School.
Ownership History
Date
Name
Owned For
Owner Type
Purchase Details
Closed on
Aug 23, 2012
Sold by
Stempel Kelly A and Stempel Adam
Bought by
Stempel Kelly A and Stempel Adam
Current Estimated Value
Home Financials for this Owner
Home Financials are based on the most recent Mortgage that was taken out on this home.
Original Mortgage
$356,000
Outstanding Balance
$247,546
Interest Rate
3.75%
Mortgage Type
New Conventional
Estimated Equity
$516,700
Purchase Details
Closed on
Dec 18, 2009
Sold by
Pickerill Charles K
Bought by
Stempel Kelly A and Stempel Adam
Home Financials for this Owner
Home Financials are based on the most recent Mortgage that was taken out on this home.
Original Mortgage
$375,200
Interest Rate
4.96%
Mortgage Type
New Conventional
Purchase Details
Closed on
Oct 25, 2007
Sold by
Harris Na
Bought by
Pickerill Charles
Create a Home Valuation Report for This Property
The Home Valuation Report is an in-depth analysis detailing your home's value as well as a comparison with similar homes in the area
Home Values in the Area
Average Home Value in this Area
Purchase History
| Date | Buyer | Sale Price | Title Company |
|---|---|---|---|
| Stempel Kelly A | -- | Tek Title Llc | |
| Stempel Kelly A | $469,000 | Git | |
| Pickerill Charles | $275,000 | Fort Dearborn Land Title Llc |
Source: Public Records
Mortgage History
| Date | Status | Borrower | Loan Amount |
|---|---|---|---|
| Open | Stempel Kelly A | $356,000 | |
| Closed | Stempel Kelly A | $375,200 |
Source: Public Records
Tax History Compared to Growth
Tax History
| Year | Tax Paid | Tax Assessment Tax Assessment Total Assessment is a certain percentage of the fair market value that is determined by local assessors to be the total taxable value of land and additions on the property. | Land | Improvement |
|---|---|---|---|---|
| 2024 | $11,999 | $166,762 | $32,604 | $134,158 |
| 2023 | $11,448 | $154,210 | $30,150 | $124,060 |
| 2022 | $11,058 | $148,230 | $28,980 | $119,250 |
| 2021 | $10,613 | $144,540 | $28,260 | $116,280 |
| 2020 | $10,365 | $141,370 | $27,640 | $113,730 |
| 2019 | $9,687 | $134,410 | $26,280 | $108,130 |
| 2018 | $9,637 | $125,980 | $24,630 | $101,350 |
| 2017 | $9,416 | $120,050 | $23,470 | $96,580 |
| 2016 | $9,163 | $113,090 | $22,110 | $90,980 |
| 2015 | $9,051 | $105,360 | $20,600 | $84,760 |
| 2014 | $9,559 | $111,350 | $32,840 | $78,510 |
| 2013 | $9,107 | $112,920 | $33,300 | $79,620 |
Source: Public Records
Map
Nearby Homes
- 5 E Washington St
- 1041 E Division St
- 194 Washington St
- 835 S Wisconsin Ave
- 326 W Adams St
- 1 S 215 Stratford Ln
- 613 S Summit Ave
- 928 S Michigan Ave
- 604 S Grant Ave
- 114 E Kenilworth Ave
- 602 Arthur Dr
- 1150 E Jackson St Unit 1A
- 415 S Highland Ave
- 316 E Highland Ave
- 208 S Highland Ave
- 37 N Addison Rd
- 118 S Highland Ave
- 616 S Ahrens Ave
- 935 E Saint Charles Rd
- 510 S Chase Ave
- 448 S Harvard Ave
- 458 S Harvard Ave
- 460 S Harvard Ave
- 444 S Harvard Ave
- 440 S Harvard Ave
- Lot 1 S Harvard Ave
- 447 S Michigan Ave
- 451 S Michigan Ave
- 437 S Michigan Ave
- 453 S Harvard Ave
- 443 S Harvard Ave
- 455 S Michigan Ave
- 443 S Michigan Ave
- 502 S Harvard Ave
- 434 S Harvard Ave
- 201 W Woodrow Ave
- 434 S Harvard Ave
- 438 S Harvard Ave
- 435 S Michigan Ave
- 455 S Harvard Ave